The New World Order
A population and GDP-driven model for forecasting aviation demand in 2050
KEYWORDS: Airports, Networks, Gravity Models
Summary

Aviation activity mirrors the expansion of urban centres through increased airport-city linkages, infrastructure enhancements, and passenger numbers. These have all accelerated over the last two decades, especially within Asia and Africa. Aviation supports vital information flow through people and goods and is a key driver of countries’ economies and business productivity despite the recent impacts of COVID on commercial travel.
Our work explores how the symbiotic relationship between global aviation networks and urban centres will evolve in response to projected changes in national indices such as population and gross domestic product. We propose that this will drive new aviation demand between cities, perhaps even leading to new airports.
We explore the use of network theory derived from computational social science and the PageRank algorithm as indicators for the attractiveness of airports based on global flights data from 2019. PageRank serves as a proxy for the average desire to visit an airport and its respective urban centre based on access to advantageous business, tourist, or social opportunities. We combine this network analysis with Central Place Theory – specifically, gravity models – to capture the spatial function of the airport as a gateway between cities taking part in the global aviation network.
Our preliminary results show that existing volumes of flights, GDP and urban population can be used as a reliable sensor for demand between airport pairs. Based on these factors, the gravitational force between cities have a significant influence on the likelihood of inter-cluster travel for business and tourism. Using relationships derived from 2019 data, we forecasted future demand for airports, travel destinations and urban centres through case studies in South and Southeast Asia. While 2019 flights emphasizes western European and North American cities, our projections show that by 2050, many of the aviation hubs will be in East and Southeast Asia.
Introduction

Despite the negative effects of COVID19 on global aviation, the industry remains a key driver of people, economies and productivity. Global population growth trends and the growing middle class in Africa and Asia are expected to have a significant impact on aviation, influencing not only where people live but where they travel (UN, 2019). IATA (2018) forecasts more travellers coming from new markets with growing middle classes in the next few decades, specifically from these two regions. This is compared to today’s traditional markets from Europe and North America.
We believe this will create significant demands on airlines and airports as well as increase connectivity between traditional hubs and new destinations. Our work investigates how changing demographics and economies in 2050 will influence the configuration of the global aviation network, and how this could affect airports and their corresponding urban centres.
We employed network theory and the PageRank algorithm (Brin and Page, 1998) to measure the importance and competitiveness of airports in the global aviation network using 2019 flights data. Together with gravity models based on demographic and population forecasts, we identified which airport-city pairs stand to gain new connections in 2050. Based on these projections, we aim to recommend the scale by which existing airports and growing urban centres should expand or contract their operations in the future to meet future demand from existing and new markets.
Methodology
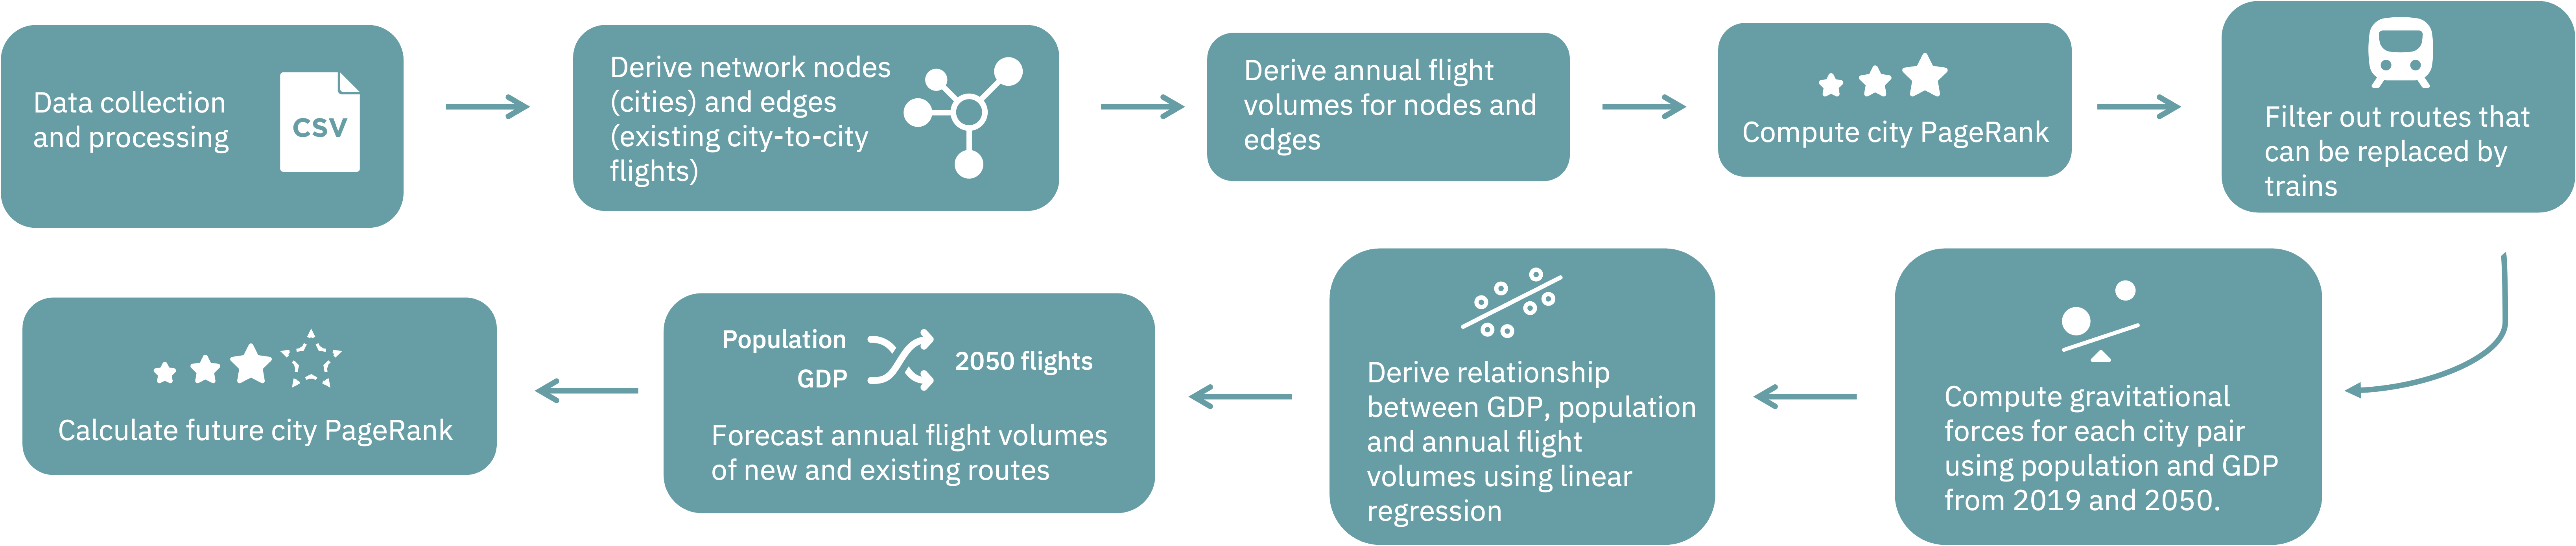
We obtained a dataset of all flights listed on airline and booking platforms from OAG’s Flights Database. This was a pre-COVID travel data set, which is deemed more representative of post-pandemic and thus, true global flight demand. We extracted flight volumes between airport pairs and city pairs for both international and domestic connections.
We constructed both international and domestic networks with airport-linked cities as nodes and flights as edges. Edges were weighted using the number of flights travelling a given route annually. Using this network, we derived the PageRank value per city based on their connections to other hubs to identify global aviation hubs and spokes. PageRank serves as our proxy metric for desirability of a city as an aviation hub.
A number of filtering conditions were then applied to the dataset to obtain a subset of routes that would influence 2050 flights, as a reflection of a global push towards sustainable travel options that is largely championed by the European Union. We removed routes that were likely to be replaced by trains in 2050, i.e. those less than or equal to 750 km and without significant water coverage based on the shortest path between origin and destination. The remaining routes were used to compute the gravitational forces between cities for 2019 based on city population and GDP.
City populations were obtained from the UN (2019). Values for 2050 were extrapolated based on country-level projections (UN) and a given city’s share of national population in 2019. City-level GDP was derived using a number of factors: pre-existing data for 2019 (OECD), a given city’s share of national GDP (OECD), and projected GDP per capita (PwC, HSBC).
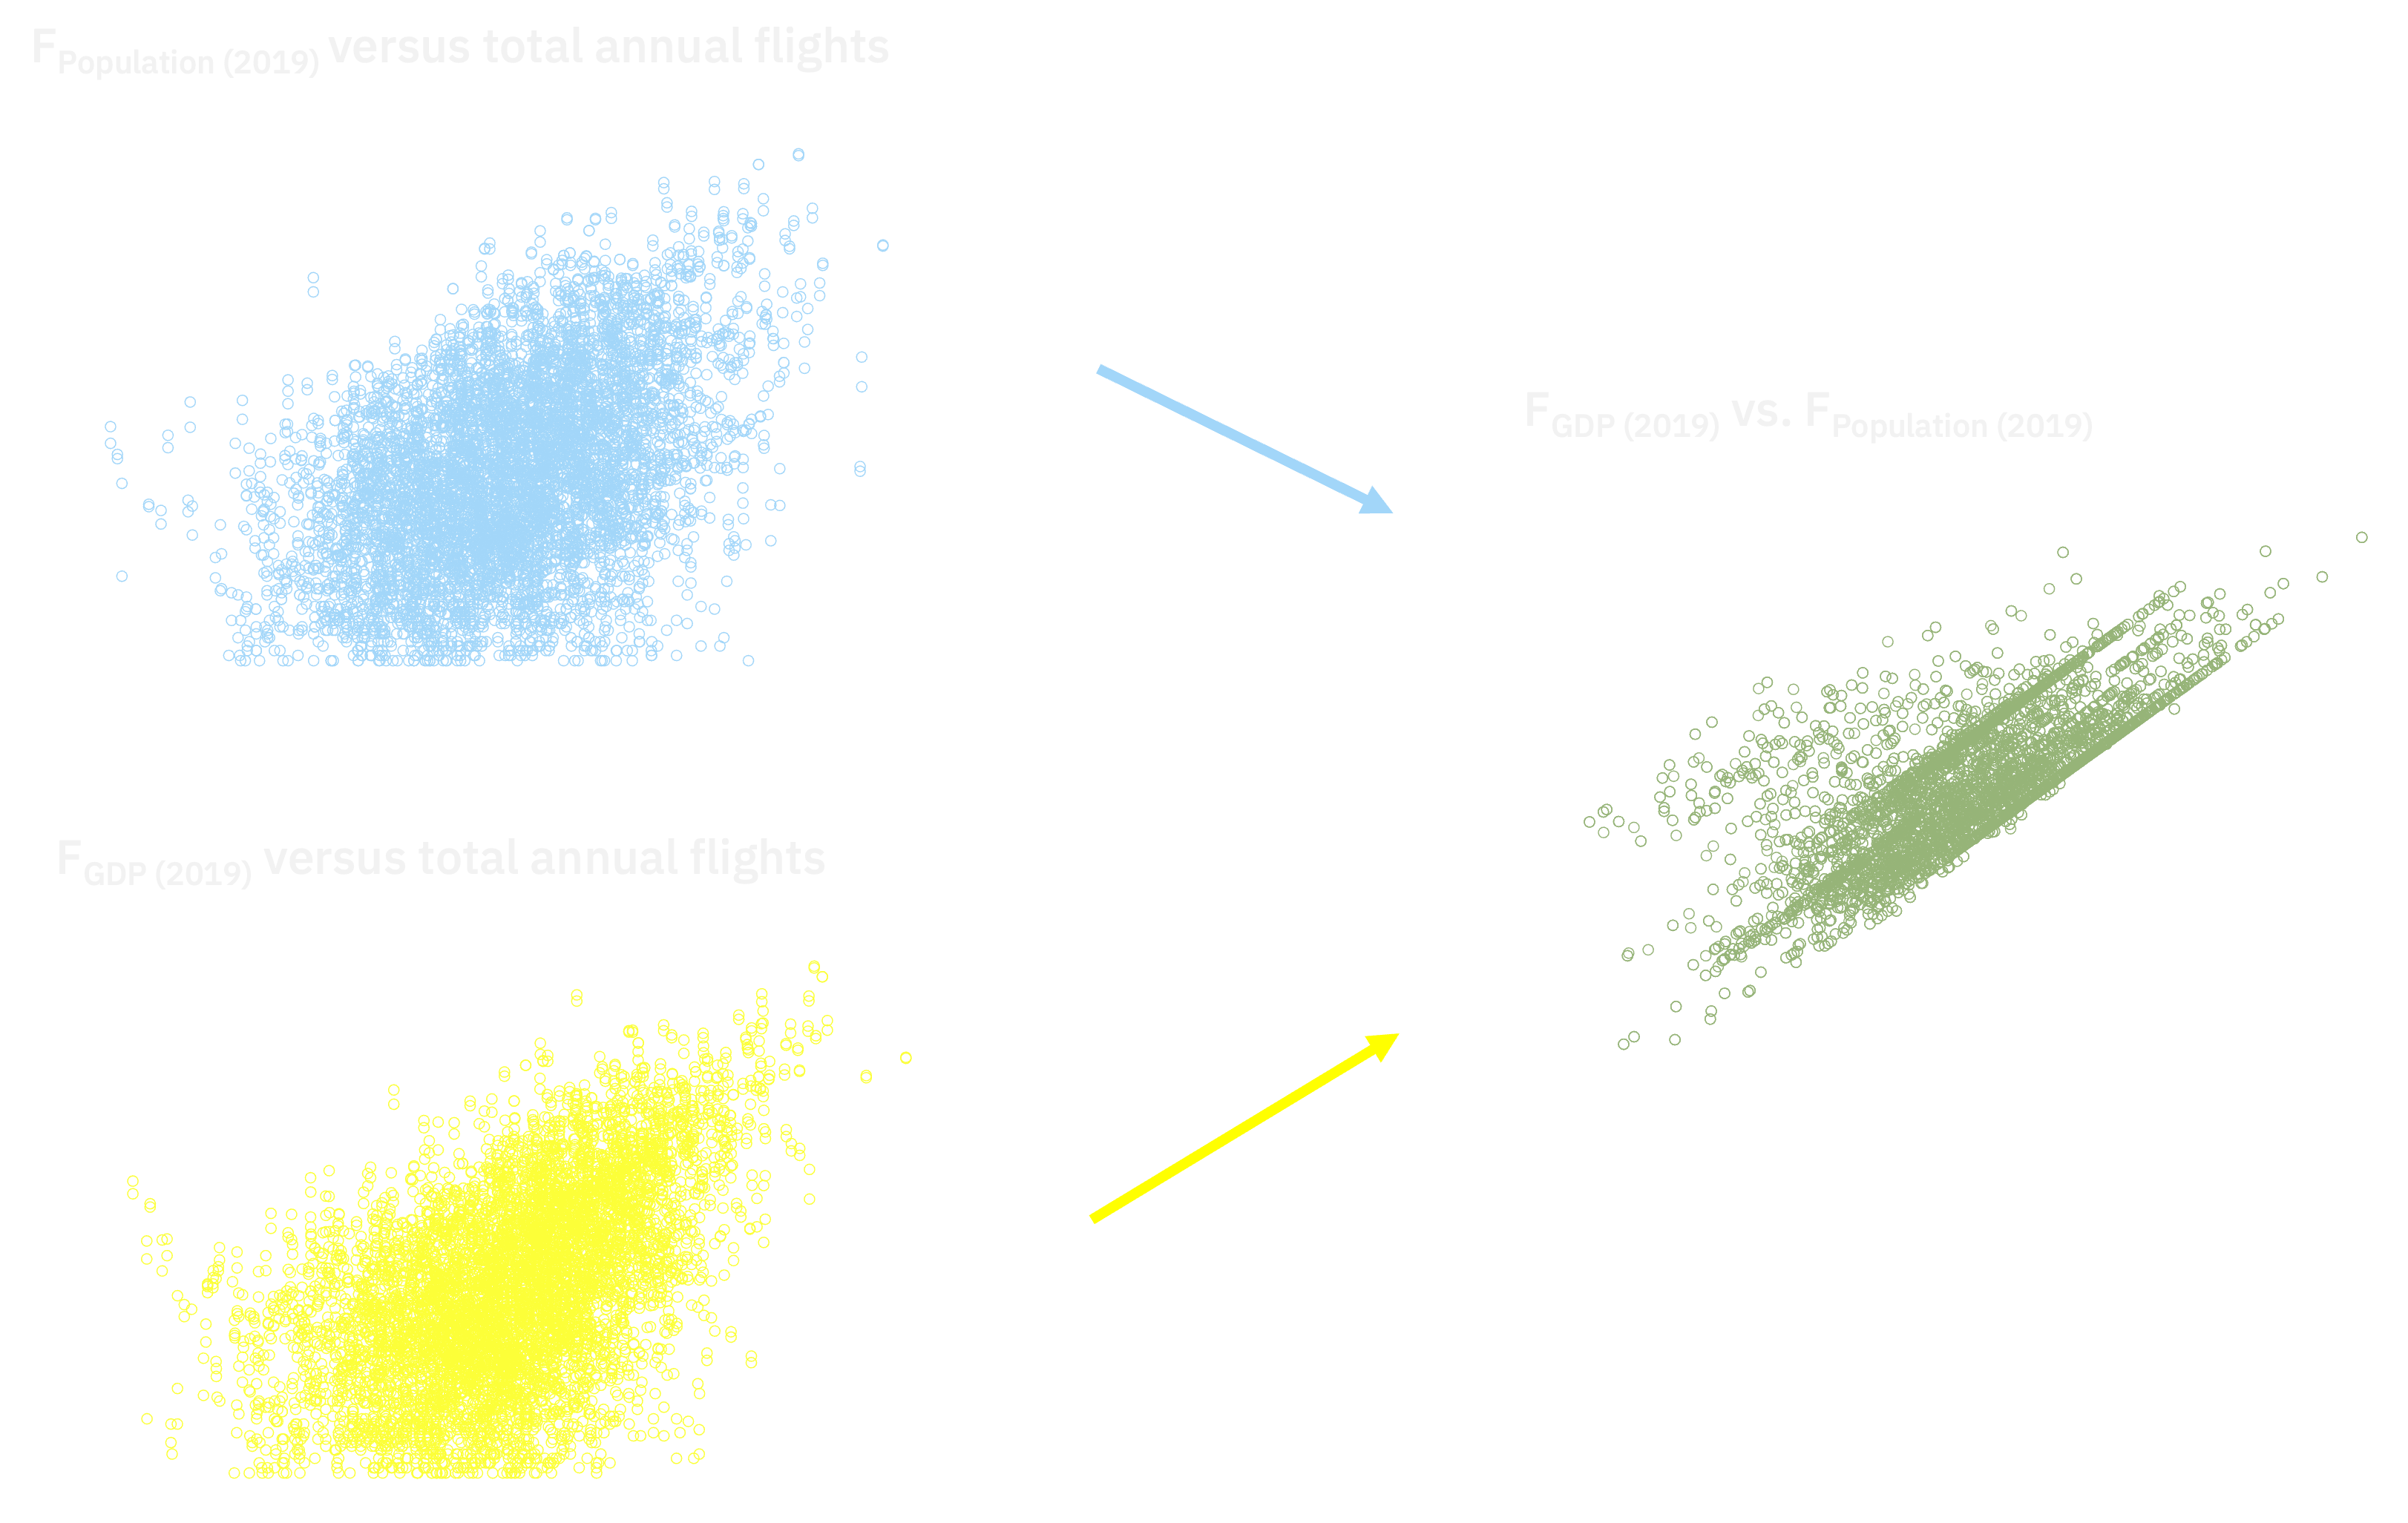
The gravitational forces for population were computed using the corresponding values of each city pair for 2019 and 2050. We used the square of the great-circle distance between cities, or the shortest distance between two cities on the surface of a sphere, as our denominator.

These gravitational forces formed the basis of our linear regression model, which showed a significant correlation between 2019 population and GDP with annual flight volumes (ICAO, 2006). This relationship is captured in the formula below. Gravitational forces from 2050 are plugged into the formula to forecast future aviation demand per route in 2050 in the form of annual flights. Again, we assume routes that can be connected by trains will not factor significantly in the 2050 aviation network, and do not include them in our projections.

We built new networks of global and domestic aviation using these projected numbers, and compute the new PageRank values per city. It is worth noting that PageRank identifies nodes with high value based on connections to other popular nodes. Just because a particular city has a high overall volume of flights annually, does not mean that it is immediately a super-hub – it could be a domestic flight hub or gateway to the region and other spoke cities instead.
Preliminary results
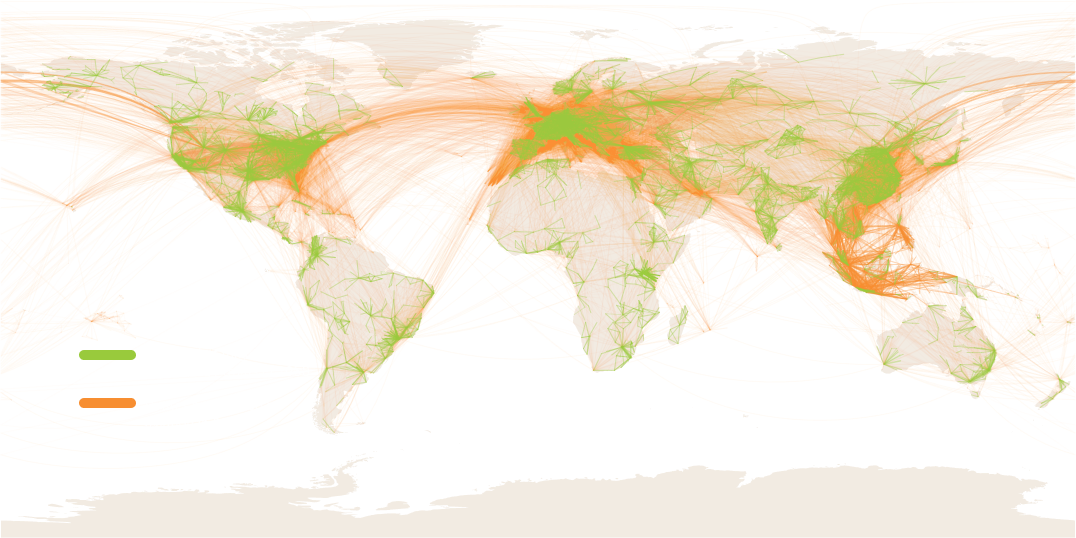
Global aviation in 2019 shows that global super-hubs are in Europe (London, Paris) with regional hubs scattered across other continents. Tokyo, Bangkok, and Seoul serve as gateways to Asia.


Meanwhile, the United States has the highest connectivity in terms of domestic flights. Several capital cities’ airports function as a crucial connection to smaller airports for national flights, namely Moscow, Jakarta, New Delhi, Beijing, and Tokyo.

By 2050, the hierarchy of global aviation hubs, as well as domestic flight networks, will look very different. Asia is poised to have 9 of the 11 global super-hubs. In terms of flight volumes, Tokyo will likely lead the pack, followed by Seoul and Istanbul. However, in terms of PageRank, the top four spots are all Asian cities: Tokyo, Seoul, Singapore, Manila. Africa will have a single entry in this list, Cairo, which is reflective of the city’s status as an economic and cultural capital in North Africa. London and Paris will retain their dominance as super-hubs but fall below these new Asian aviation centres.


Asia stands to become more well connected both domestically and regionally, with several new routes cropping up within the Philippines, China, and Indonesia. Central Europe’s push for sustainable travel implies that their domestic network will be significantly decimated due to replacement by trains.

You can explore the preliminary networks on this page, or view the list of rising and falling aviation hubs here.
Future steps
What implications do our results have for these cities? In the upcoming expanded version of this study, we aim to determine the recommended increase or contraction in scale for airports based on demand from nearby urban centres, plus the potential of other high-density areas to use these airports as their destinations. We plan to focus on the projected performance of South and Southeast Asia and to compare our results to prior research (Becker et al., 2018; Cheung et al., 2020). These regions are expected to experience significant increases in aviation demand by 2050.
Aside from GDP and population data, future work should investigate larger scale factors such as geopolitics, existing infrastructure and tourist demand. Moreover, our methodology is focused on the airline industry. Future analyses could potentially include high-speed rail, electric vehicles, and electric vertical take-off and landing (eVTOL) aircraft.
Conclusions
Forecasts for GDP and population show a shift towards Asia (OECD, 2019; UN, 2019). Our model demonstrates a similar effect on future aviation, with more connectivity between Asian countries. We also see new domestic connections between cities in Asia for countries such as China and the Philippines.
References
- Becker, K., Terekhov, I., & Gollnick, V. (2018). A global gravity model for air passenger demand between city pairs and future interurban air mobility markets identification. In 2018 Aviation Technology, Integration, And Operations Conference, Atlanta, Georgia, 25-29 June.
- Brin, S., & Page, L. (1998). The anatomy of a large-scale hypertextual web search engine. Computer networks and ISDN systems, 30(1-7), 107-117. ICAO (2006). Manual on Air Traffic Forecasting.
- Cheung, T. K., Wong, C. W., & Zhang, A. (2020). The evolution of aviation network: Global airport connectivity index 2006–2016. Transportation Research Part E: Logistics and Transportation Review, 133, 101826.
- Schläpfer, M., Dong, L., O’Keeffe, K., Santi, P., Szell, M., Salat, H., Anklesaria, S., Vazifeh, M. & West, G. B. (2021). The universal visitation law of human mobility. Nature, 593(7860), 522-527.
- United Nations, Department of Economic and Social Affairs, Population Division (2019). World Population Prospects 2019, Volume I: Comprehensive Tables (ST/ESA/SER.A/426). IATA (2018). Future Of The Airline Industry 2035.