Aerial Analytics
Application of Machine Learning on Satellite Imagery for Urban Planning Analytics at Mass Scale
Part 1 – Data collection and retrieving Satellite Imagery
This article demonstrates an automated Python-based workflow to collect, process, retrieve and compile multiple high-resolution satellite images for analysis; it discusses the challenges during the process and also elucidates the beauty of the presence of such data which is highly valuable to understand the earth and its natural and human geography.
Introduction
Data is the oil of the 21st century. With the recent boom in technological advancements, it is now possible to source, compile and archive large amounts of data and with analytics refine from it informed insight. Satellite Imagery is one of the most powerful data resources used in multiple industries, the government, and for research purposes. Satellite images find uses in meteorology, urban planning, climate change monitoring, disaster relief, census, remote sensing, and geology. Since its’ first development in the 1950s, countries have been pushing for innovation in space technology, with emphasis on earth monitoring always. This has enabled governments, private entities, and increasingly the general public access to valuable information and tools that can be used in various systems like military, cartography, agriculture, policy-making, and even a simple trip to the shops.
In 2014, the European Space Agency unveiled its Copernicus program, which aims at launching phased earth observation satellite systems for atmospheric monitoring with special bands for RGB, Infrared, Aerosol, and Cloudiness. The most exciting potential of the Copernicus Sentinel program is that it is free to access. This provides a great platform for researchers, academia, and personal enthusiasts to monitor the land and ocean.
There are two ways to access the Copernicus Sentinel Interface. First is through an easily accessible web interface that allows the user to manually draw an area of interest as a polygon which then proceeds to query the satellite database for matching captures in that area. The second is the Sentinel2 Python API which is more powerful as it allows for advanced and automated access to the data. We are going to explore the latter of these.
Sentinelsat (a python package) enables query, filtering, and sorting of sentinel product tiles before download. A tile in sentinel terminology is a single capture, which is usually 100km x 100km square of a region. Sentinel2 is on a Sun-synchronous orbit moving pole to pole capturing the whole of the earth’s surface under similar daylighting revisiting each location every 5 days, meaning that the same location is visited by the satellite in that time frame for the whole of the year from the first satellite launch.
Utility and Beauty
An admirable quality of ESA’s Copernicus mission is that its data is under an open-access license making it free to collect, process, distribute, and use for research purposes. A beneficial step towards taking technology to the public and allows all to learn more about the earth directly with real data. The second positive for analytics is the resolution of the images. Sentinel RGB provides images in 3 different resolutions (10m, 20m, 60m – 10m meaning each square pixel represents a 10x10m piece of land) which is significantly higher than other open access satellites such as Landsat, which though has a higher resolution is a paid service thus cutting off access to the public.
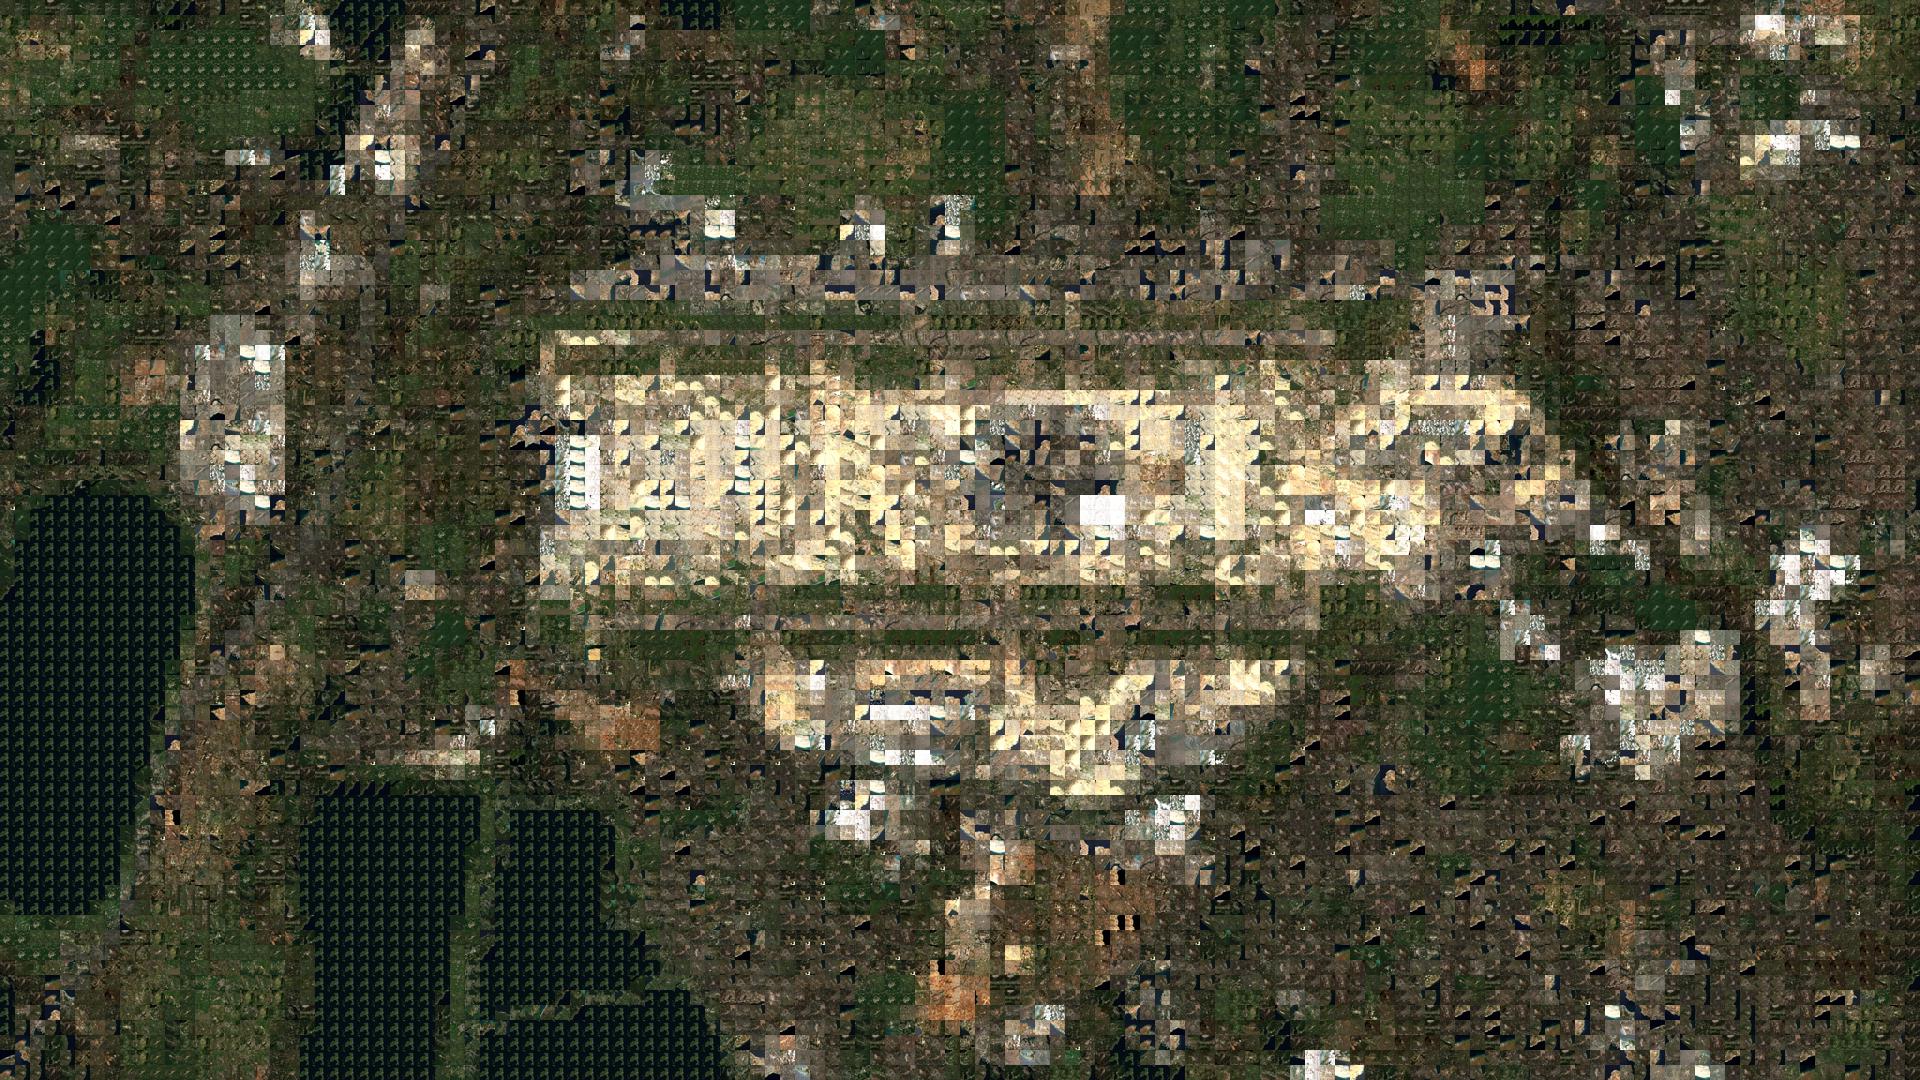
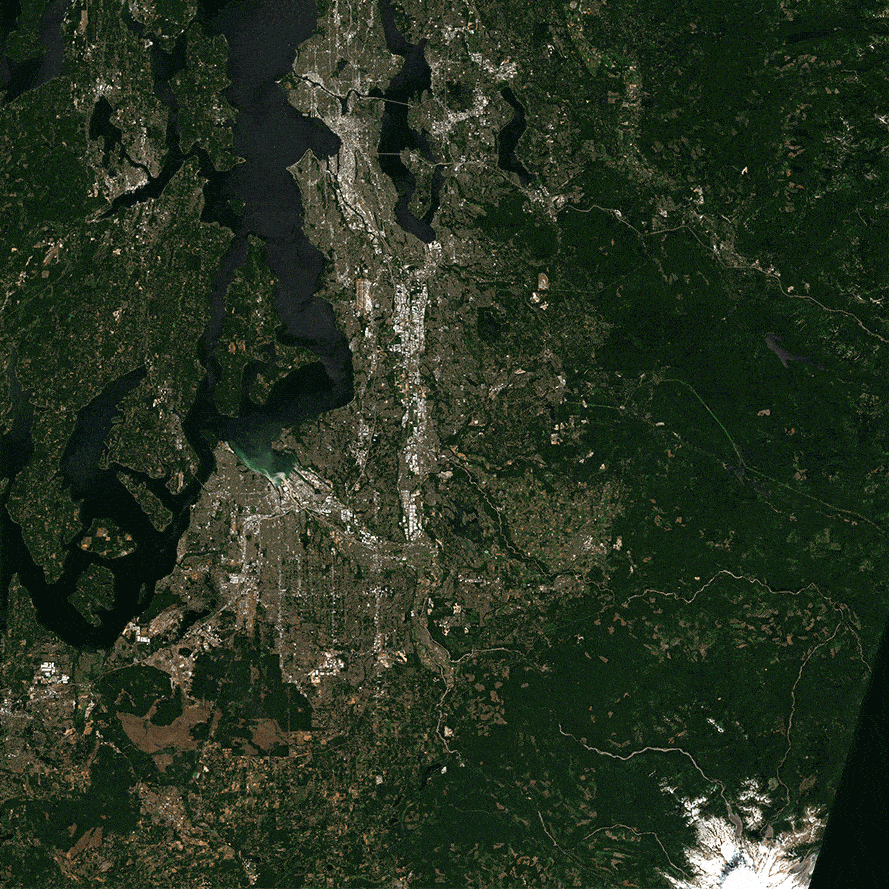
Satellite images are visually pleasing entities to look at. The sheer geological and organic variation over the whole earth's surface shown at this resolution is a fascinating series of natural and manmade features. These include geographies such as flat plains, mountains, forests, water bodies, agricultural land, and cities.
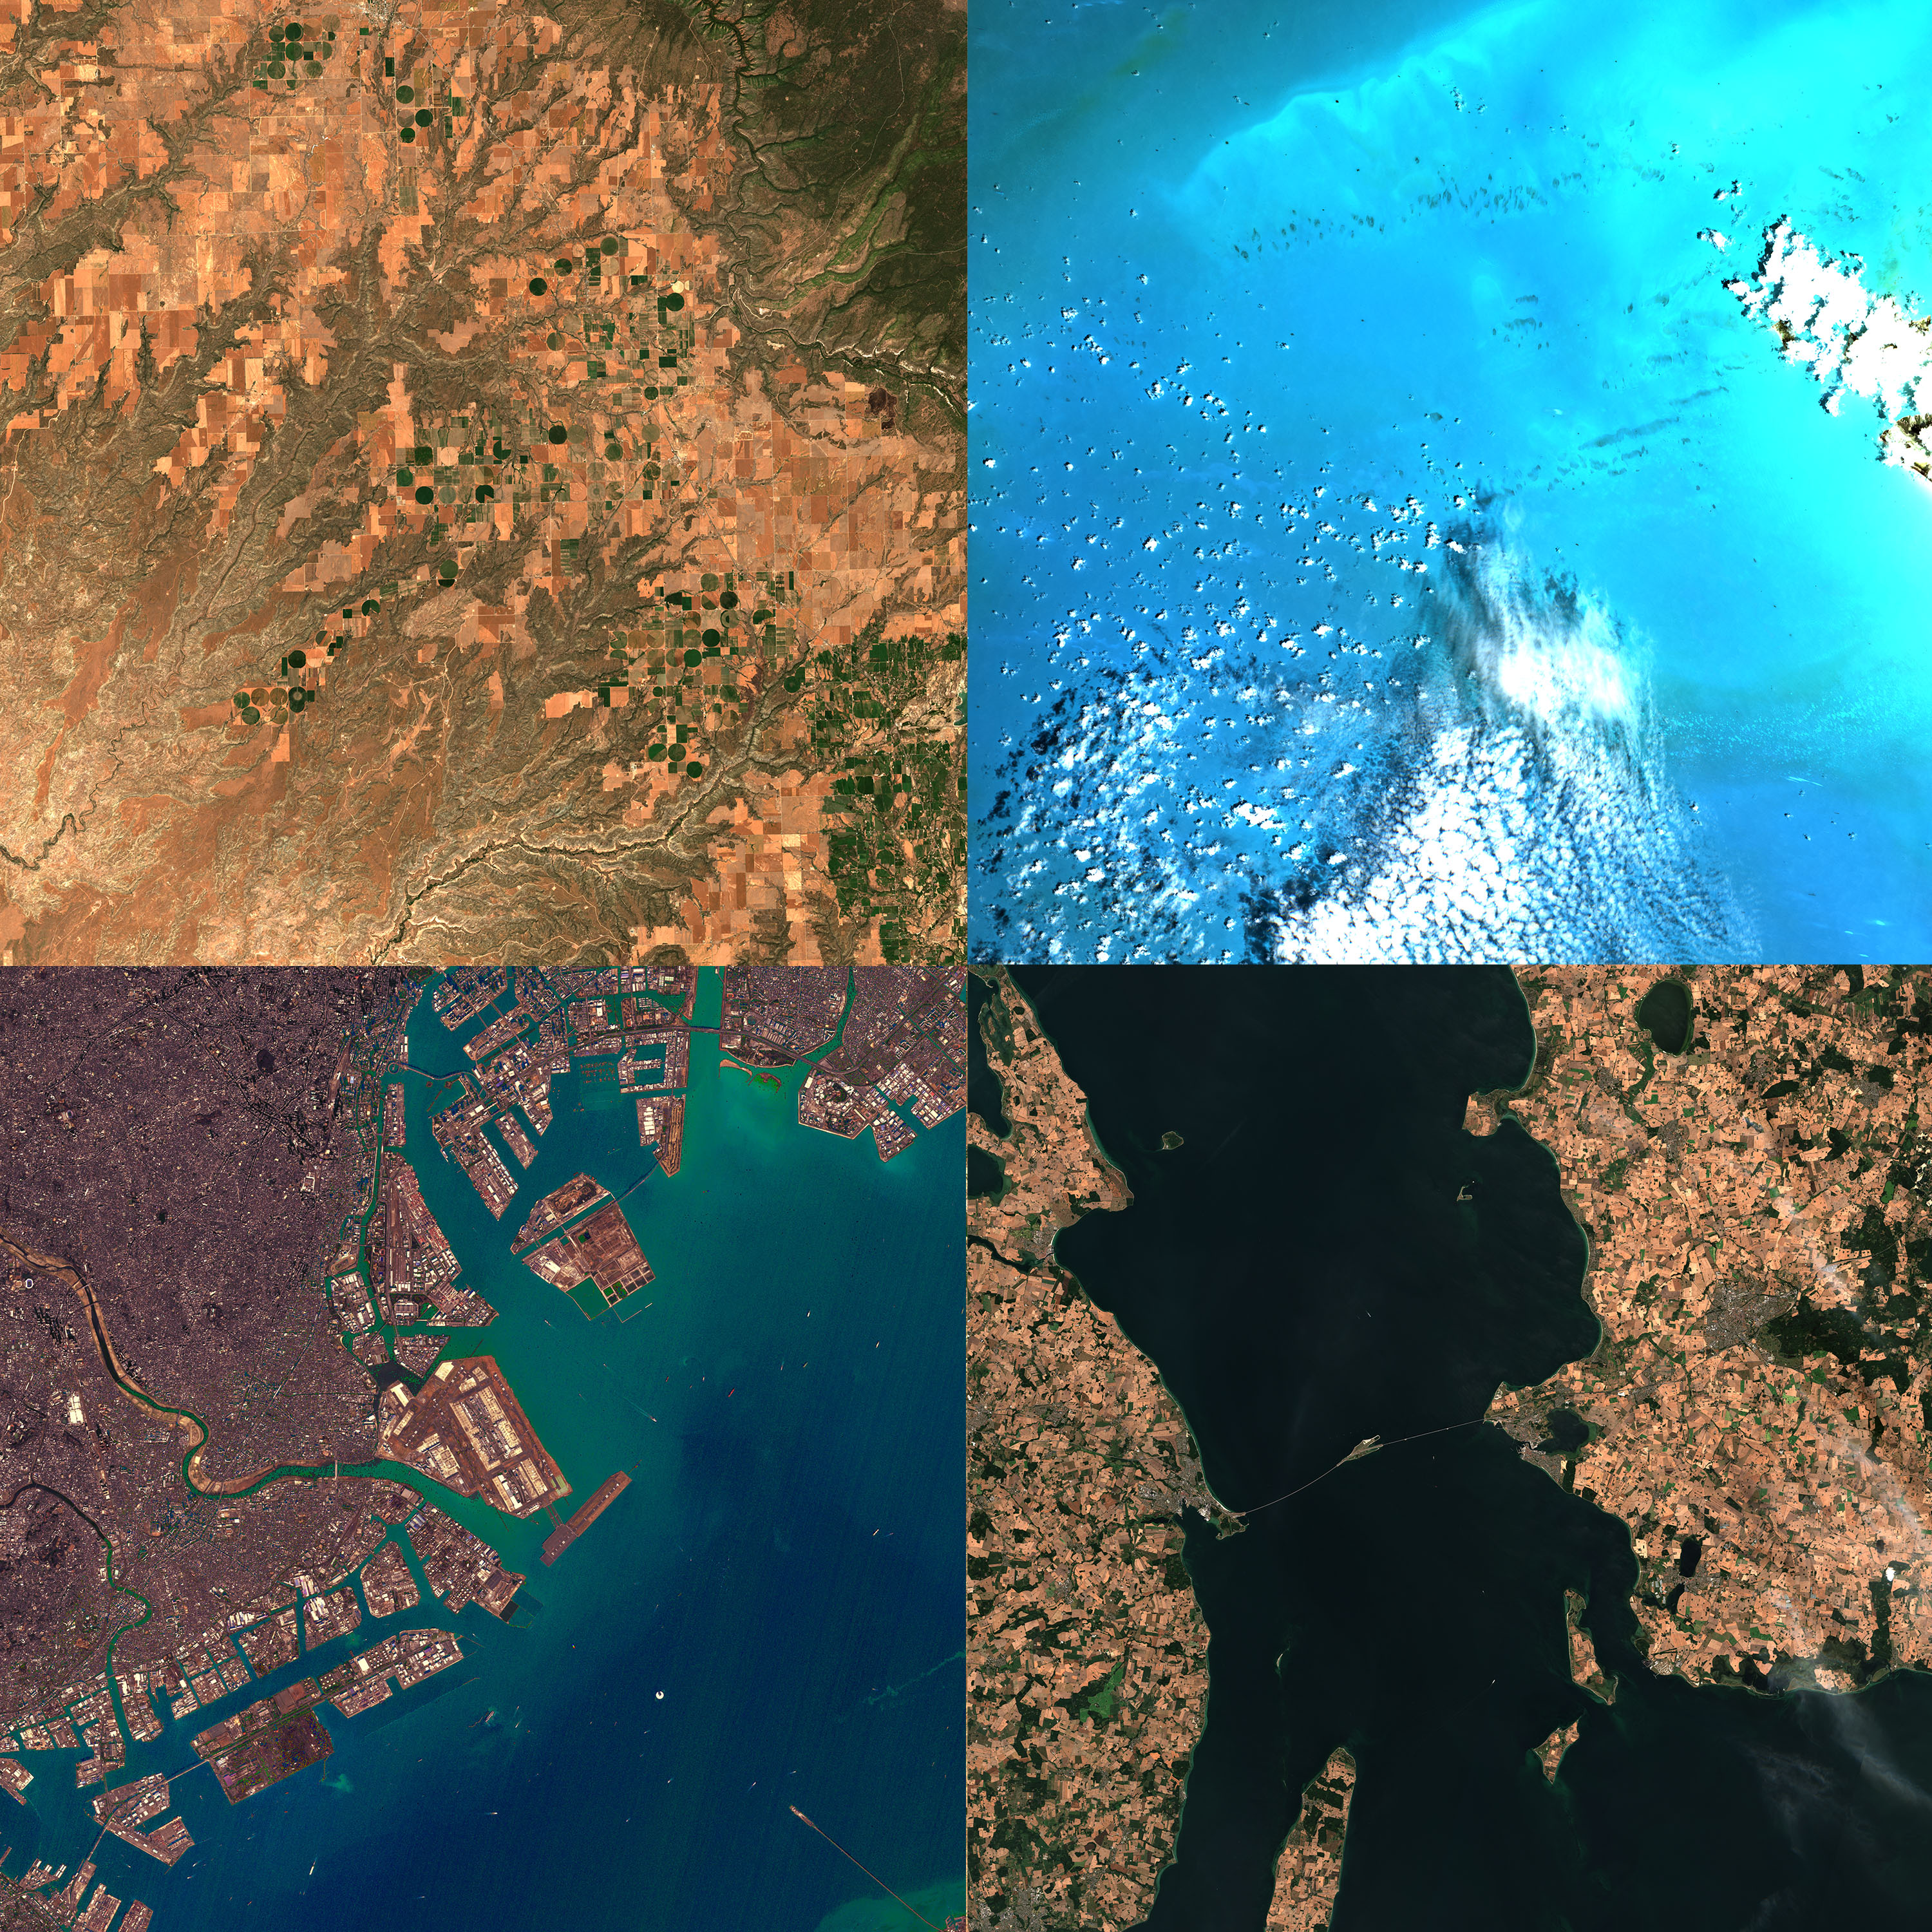
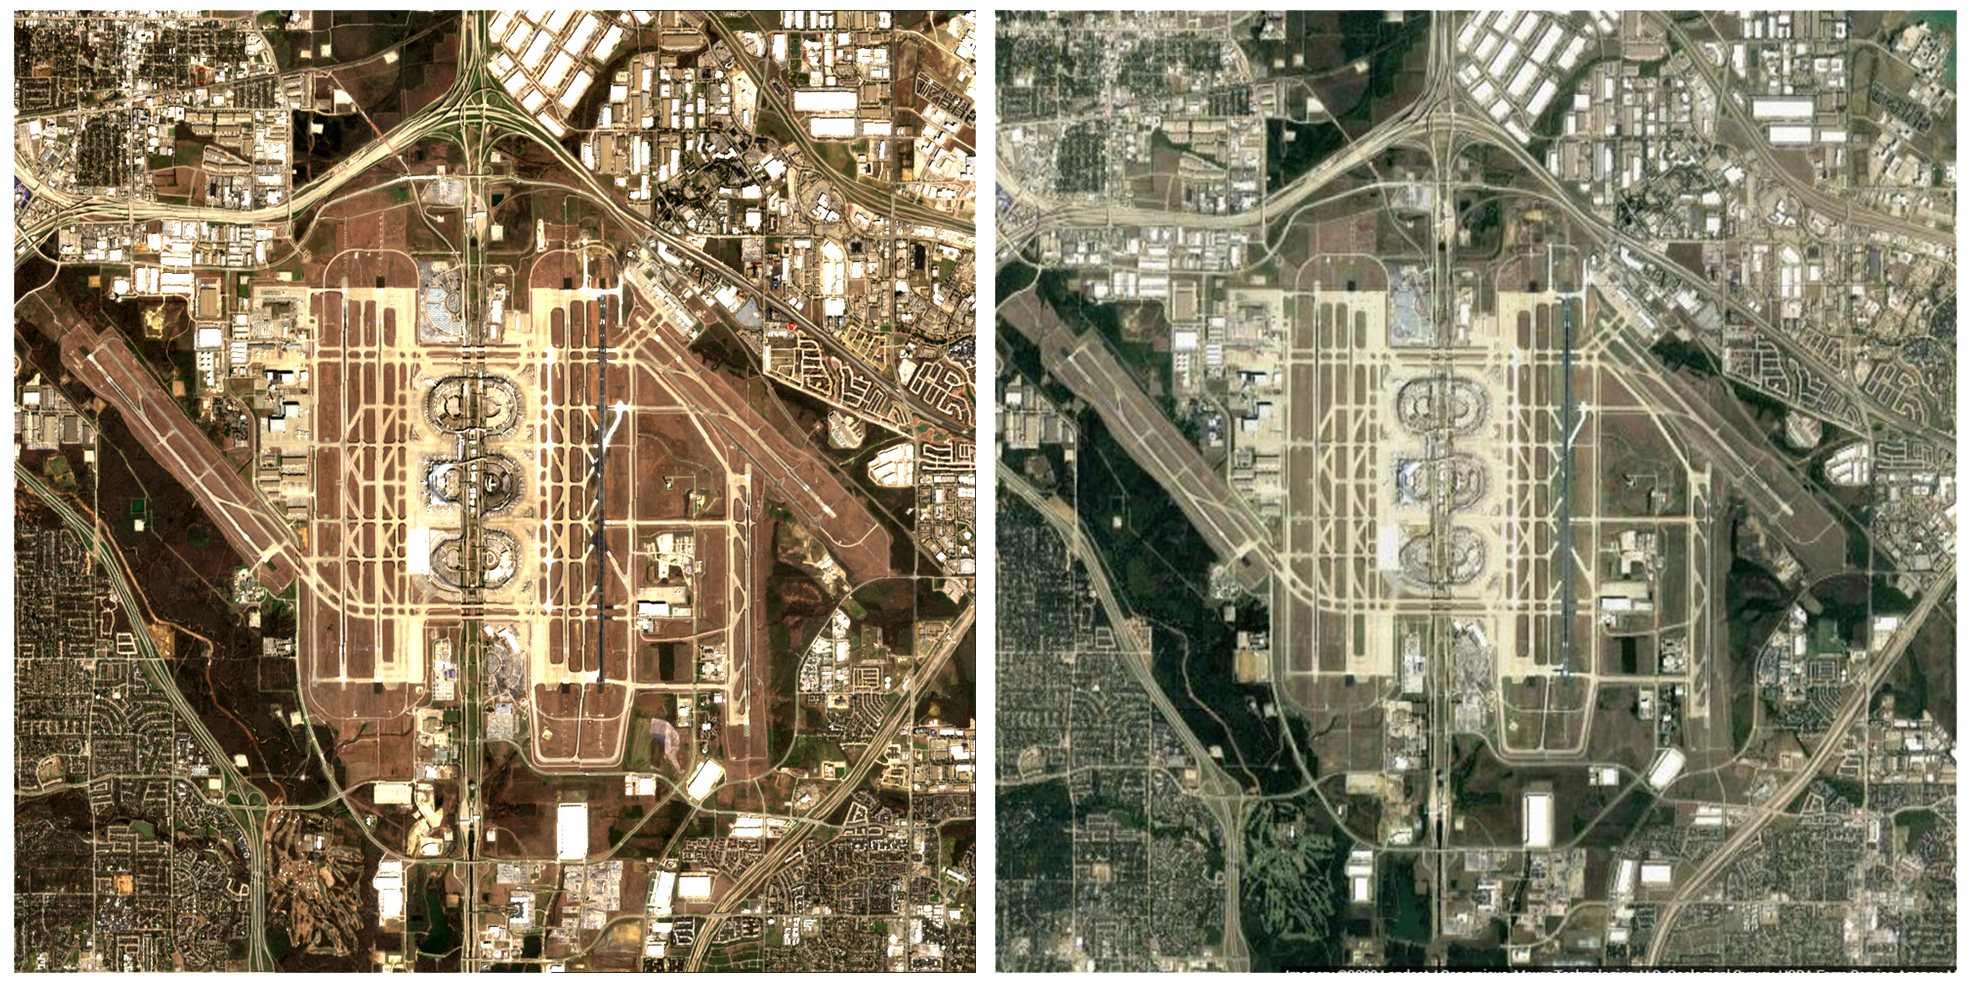
The potential of this technology is hard to understate since it allows one to understand the earth in a spacio-temporal manner. From monitoring the changing land-use patterns in an urban context, overlooking the progress of construction of large-scale infrastructure entities such as airports, mapping disasters such as floods, forest fires the true potential of this open-access database is harnessed only when applied.
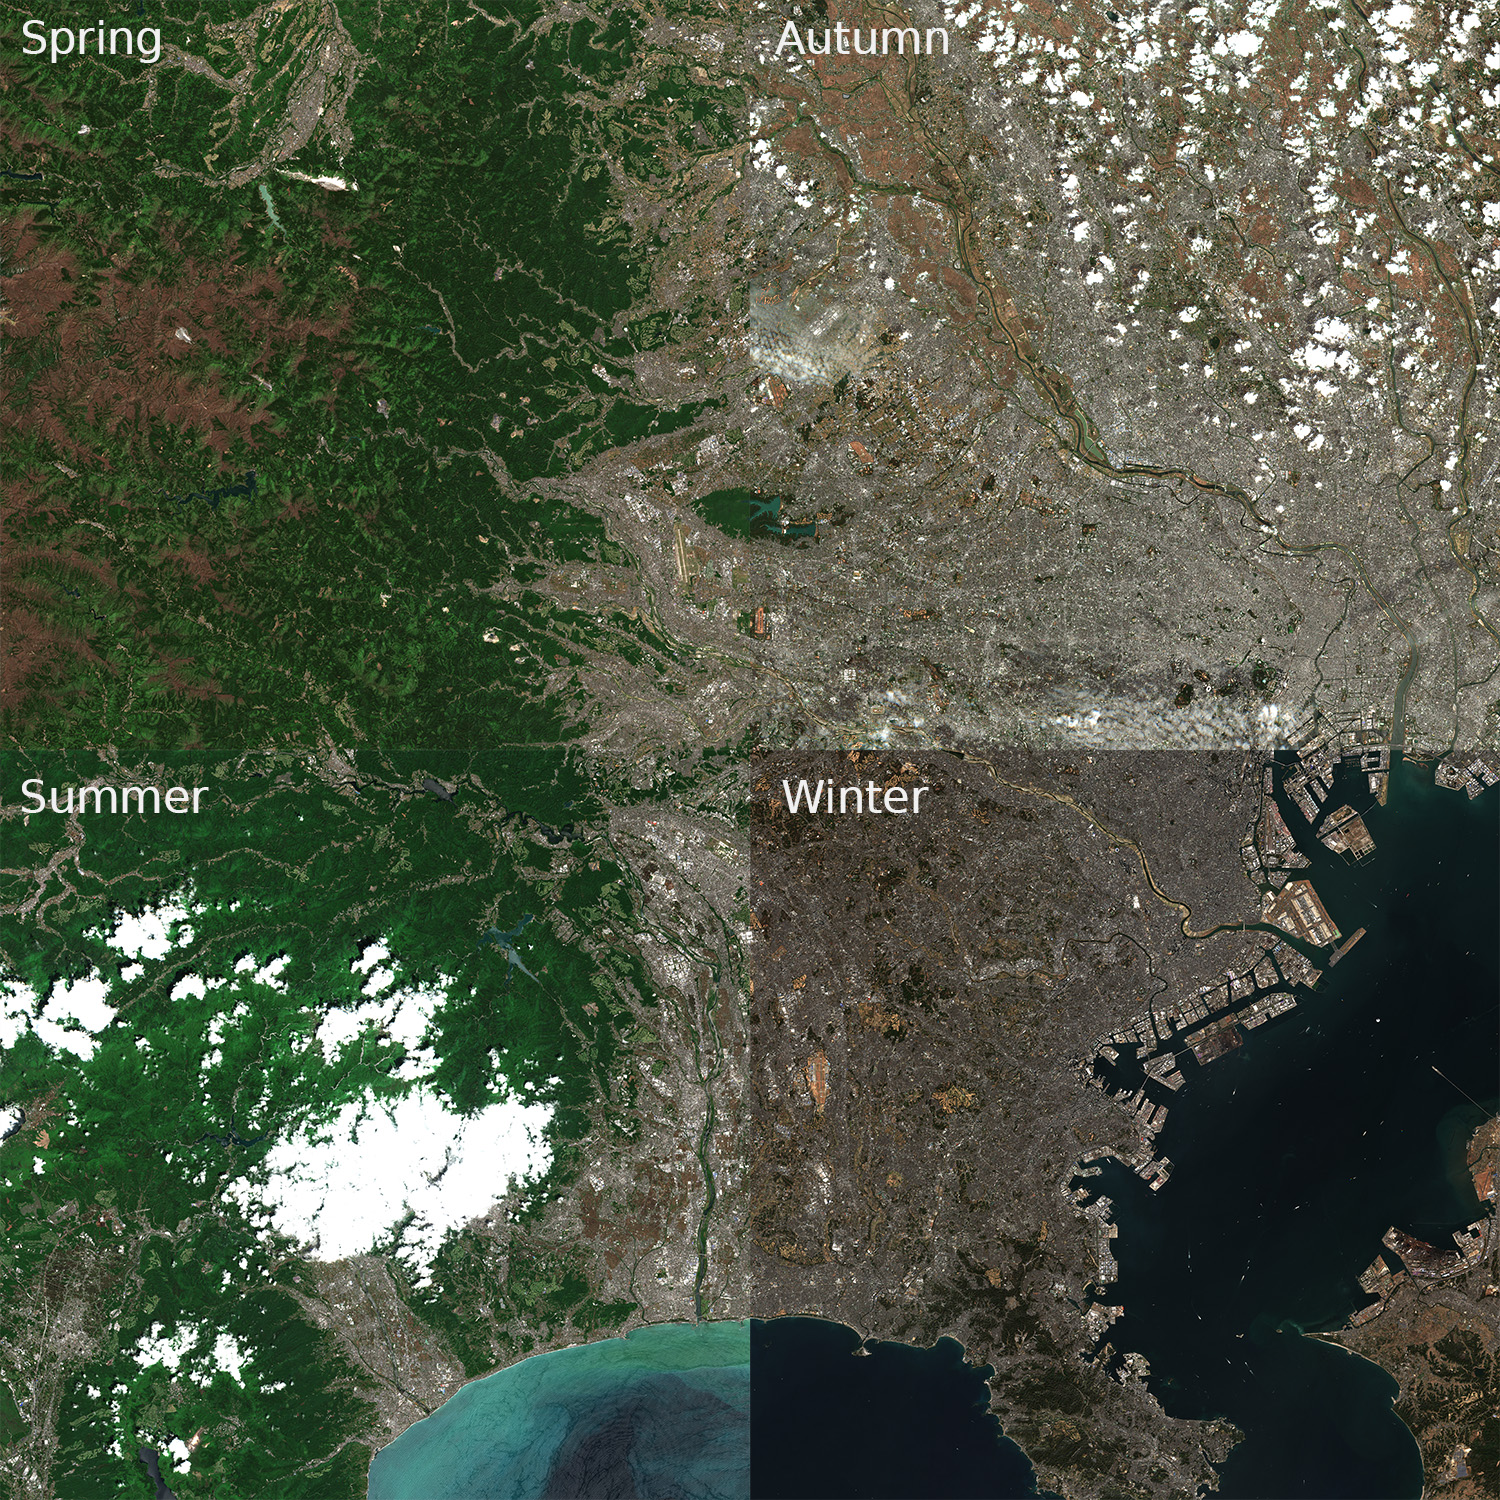

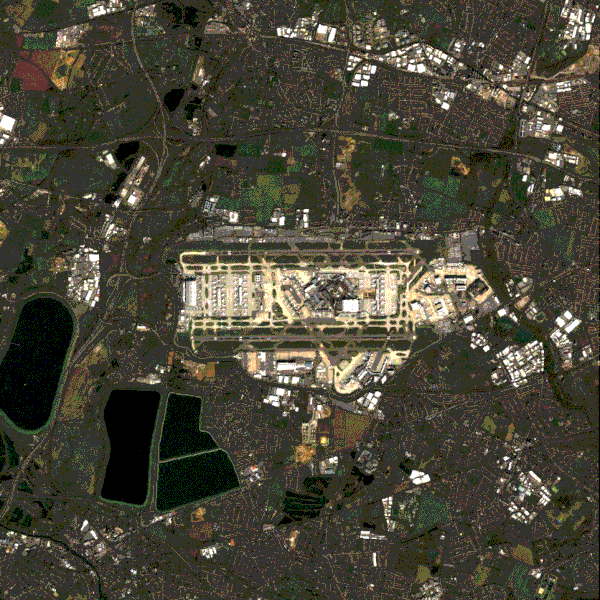
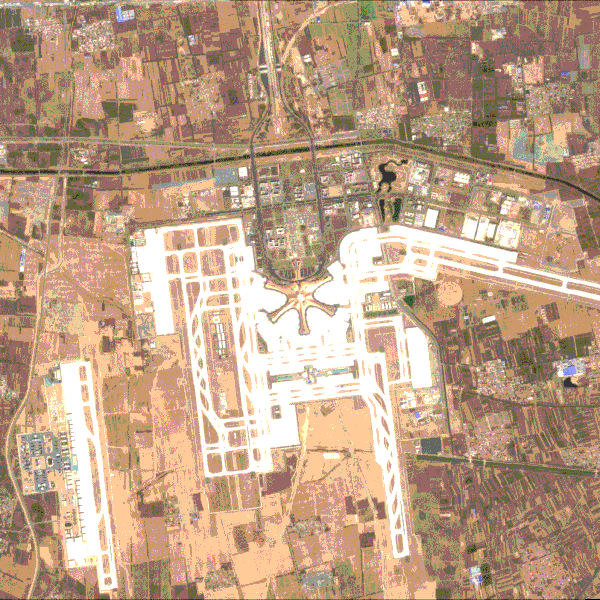
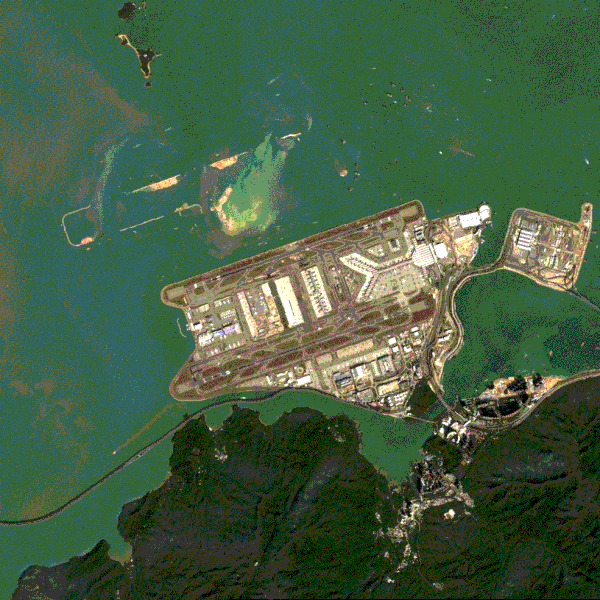
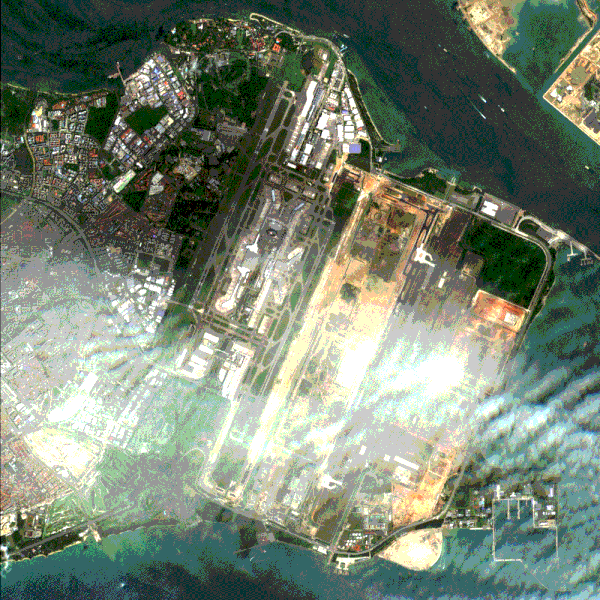
Temporal changes in landscape and land use visualised through GIFs for London, Daxing, Hong Kong and Singapore Airports.
Making it Work
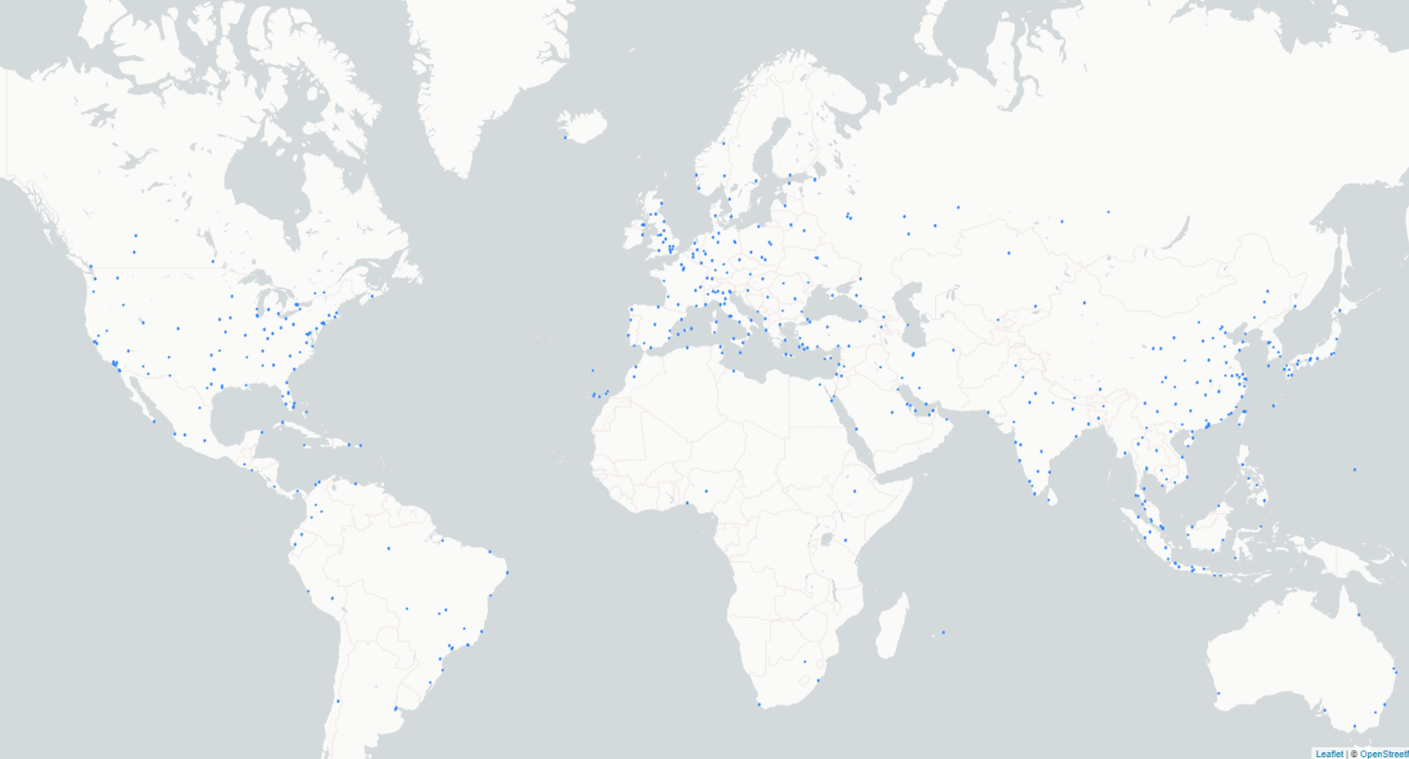
The motivation here is to build a workflow, which will allow us to collect, download, and process a batch of sentinel images of any given dataset containing the parameters required by the API. Specifically in this case focus is on the rapidly changing aviation industry and hence we will be collecting a database of world airports. This would be extremely useful to compare and perform side-by-side analyses of airports for different parameters such as their size (land area), number of runways, runway orientation, urbanization around the airport, and presence of water and/or other natural features in the vicinity.
Data sourcing and collection
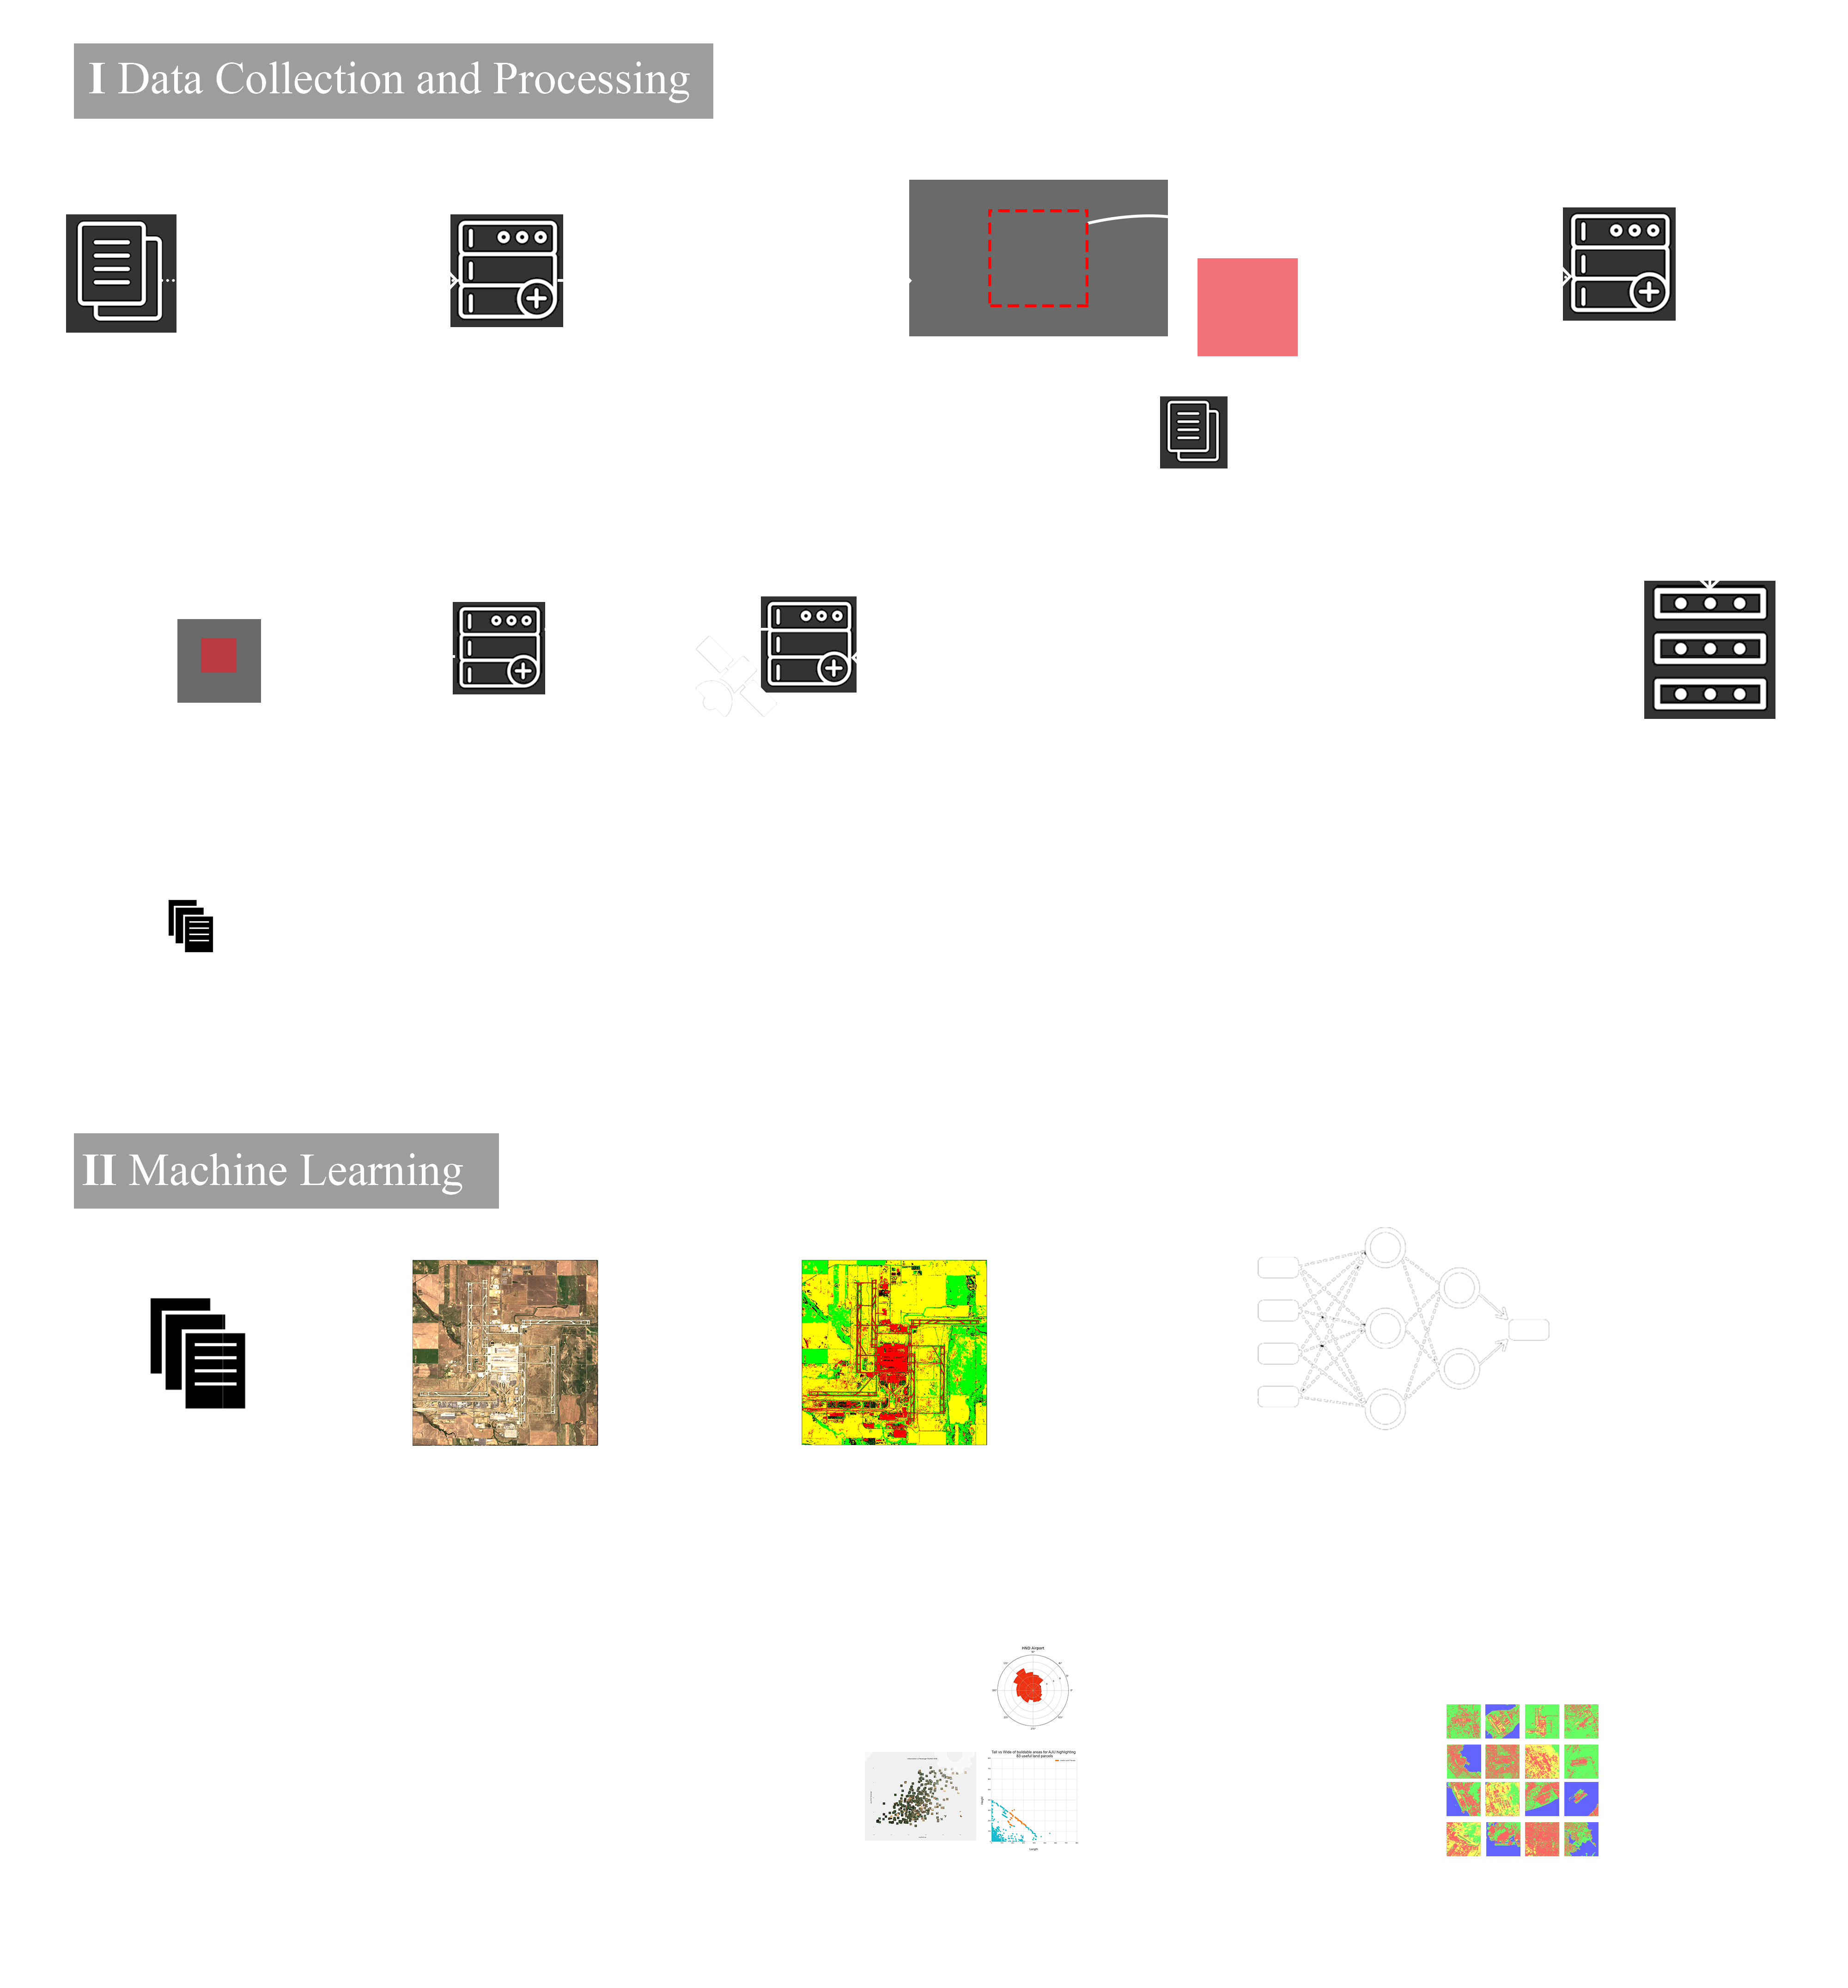
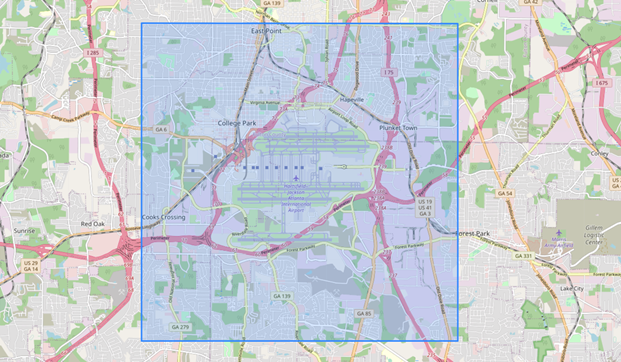
We will be leveraging the potential of open source community and all the following processes are performed in Python programming language and all the packages can be found at pip. To collect any kind of aerial imagery, we would need the geo-coordinates such as latitude and longitude of the desired location. We sourced this data from Aviation Fanatic (www.aviationfanatic.com) and used BeautifulSoup to scrape through the pages of this website and compiled it into a CSV file. This was then combined with the IATA’s own open-access dataset of world airports which was used to validate the authenticity of aviation fanatic. Since we are looking at a piece of infrastructural entity such as an airport, which spans area we require a boundary that we will construct using Python’s Pygc, a spatial projection library. We will construct a square of side 10km by keeping the terminal building at the center. This produces a shapefile, and this shapefile was then passed into Sentinelsat (Sentinel Copernicus API for Python).
According to its documentation, the API also supports other keyword arguments, a few of them are listed below:
- Datetime – A range of dates can be passed as a string to query the database for available sentinel tiles. A short correction was made to get the best possible image during Spring-Summer due to season inversion across hemispheres.
- Cloudcoverpercentage – A number indicating the preferred cloud coverage for the tile.
- Limit – The number of tiles in a single search
- Contains – This ensures a strict intersection of our shapefile with the tile (100% inclusion)
The API returns a list of “Products” (a 100 sq. km tile), which have a Unique Identifier (UUID) and contains a dictionary of metadata including its date of capture, ingestion, and other satellite calculation data in the form of a Pandas data frame structure. In this exercise, since we are looking for the best image available of each airport, we sort the results according to the cloudcoverpercentage for each airport tile. The UUID of the best tile is stored in a variable progressively, while the other tiles are stored as backup and for metadata.
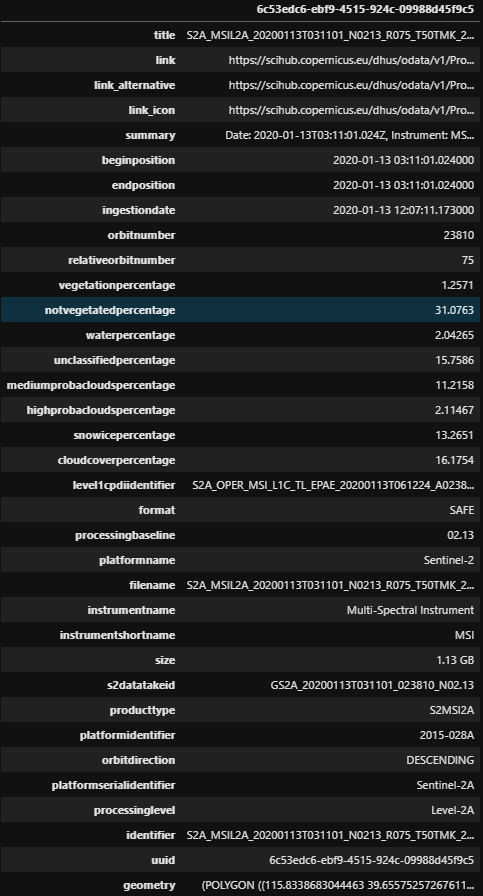
Once the query process was completed and results returned, the API’s download function was called, with the variable containing the UUIDs was passed. Each tile consumed ~1.2GB of data on local storage, hence we processed the images in batches of 50 to save hard drive memory.
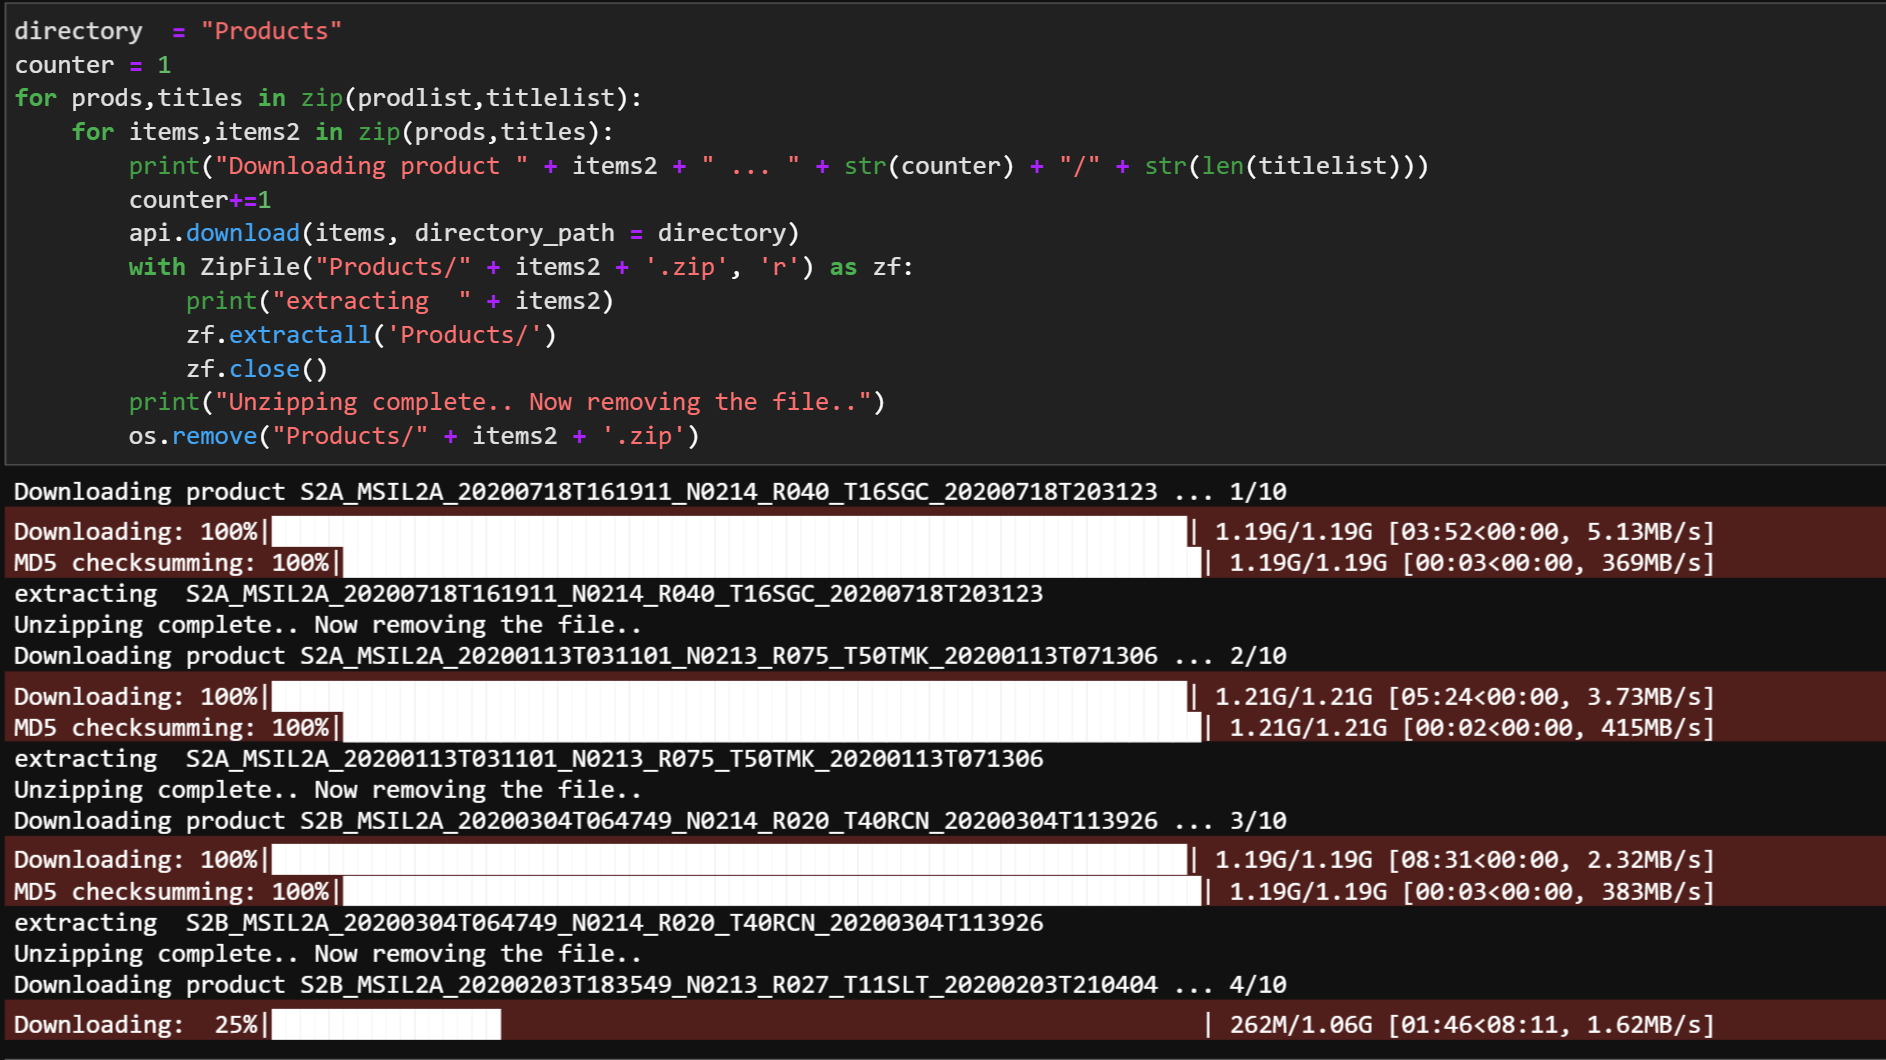
The download process took most of the time, since it relied on the bandwidth and storage, the two most critical variables in computational processes. The Sentinel Products were downloaded as zip files, and they had a complex folder structure containing metadata and other satellite sensor data. The folder structure was then studied to retrieve the raw RGB image from each zip package, which was present in an OPENJPEG format. This was processed using a Python library called GDAL. At this point, the image tiles had to be masked to our boundary of interest. Hence, the tiles had to be re-projected to EPSG:4326 a widely used spatial projection convention, since our Pygc boundary for all airports were in EPSG:4326. This was made possible by the GDAL’s warp function, which took the source, destination, source projection, which was retrieved from the tile metadata and the target projection. This process created a folder full of 100km tiles warped to the new projection in a TIFF format.

To clip out the boundary of interest from the large tile, a library called RasterIO was used, which had a mask function taking in the spatial boundary and the original tile, saving out a clipped file of resolution 1000x1000 (since our original resolution of 10m/pixel). The images are saved out with a standardized naming convention containing the IATA code and date stamp, a JSON dictionary of which is saved separately for future analyses.
The semi-supervised nature of this workflow allows for more benefits in the algorithm to accommodate changes to the resolution, batch processing and to visualize the boundaries before it is queried since time and storage are the limiting factors determining the program’s efficiency. Also, since it is the first version of this workflow, some of the methods used may not be computationally efficient, which will be rectified eventually in future versions of this work. Nevertheless, the ability to capture and store tons of satellite data of any desired location at any point of time is a powerful weapon for Architects, Planners, Data Engineers, the government, and earth enthusiasts enabling them to monitor and look at the earth from an interestingly different perspective and helps design & planning for a better future.
This topic with be further be explored in part 2 of this study series Which can be found using this link: here .
If you are interested in this work please get in touch with us.
(All the satellite images displayed in this article are the property of ESA© Copernicus Sentinel unless stated otherwise)