Aerial Analytics
Application of Machine Learning on Satellite Imagery for Urban Planning Analytics at Mass Scale
Part 2 – Machine Learning and feature extraction
(All the satellite images displayed in this article are the property of ESA© Copernicus Sentinel unless stated otherwise)
This article is an extension to the Part 1 of the ‘Aerial Analytics’ project. Click here if you have not yet read it.
Click here to read the full paper featured in ACADIA 2020 - Distributed Proximities .
Introduction
In the previous article, we have discussed the computational methodology for collecting and storing large amounts of satellite images in a semi-supervised manner. This is highly useful especially for architects, urban planners and researchers who need access to large amounts of spatial-temporal data for planning and policymaking. One such problem which may arise is the manual intervention involved in identifying different types of land use from these images which could often take a lot of time and is inefficient in the first place. In this article, we discuss an approach that could automate this task and enable us to perform analytical operations and pixel-level calculations on these images to derive meaningful insights on our fingertips.
Also, it would be an interesting thought as well as a study to identify latent patterns and attributes in these images which could give us more information about our built environment enabling us to perform complex analytics on these metrics to understand the situation of congestion around the world’s airports, for instance.
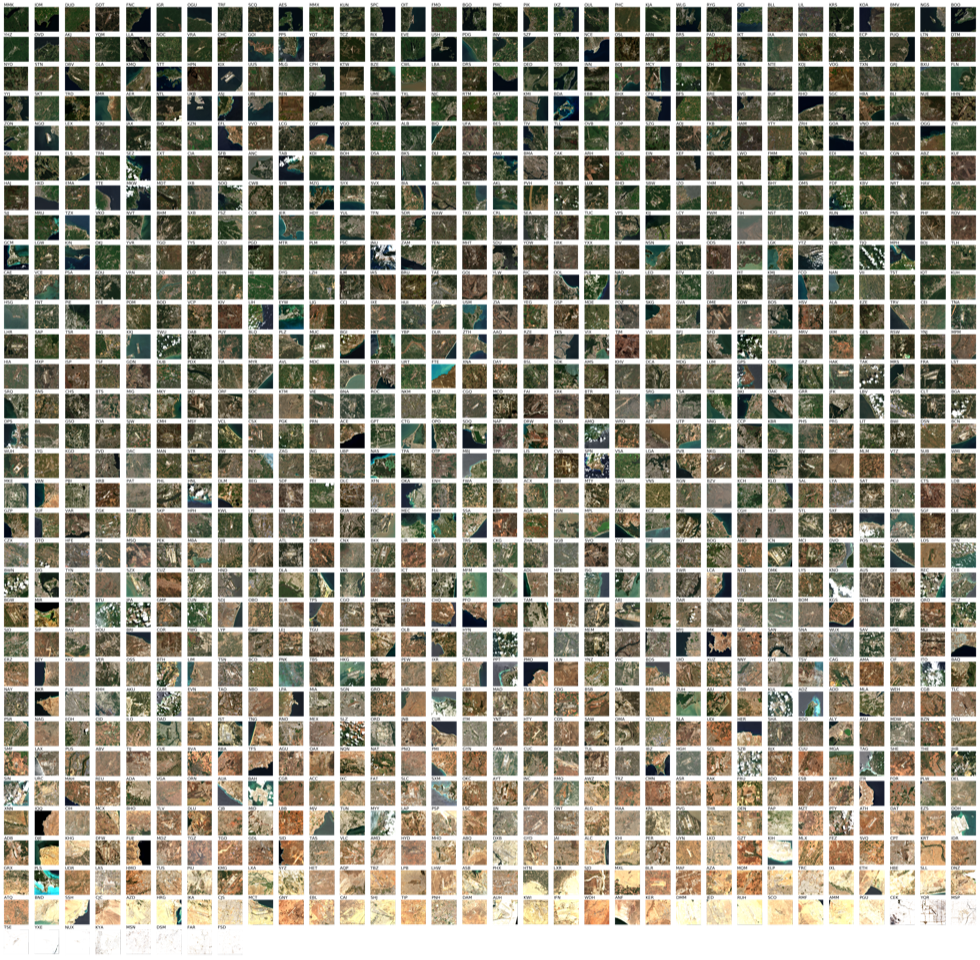
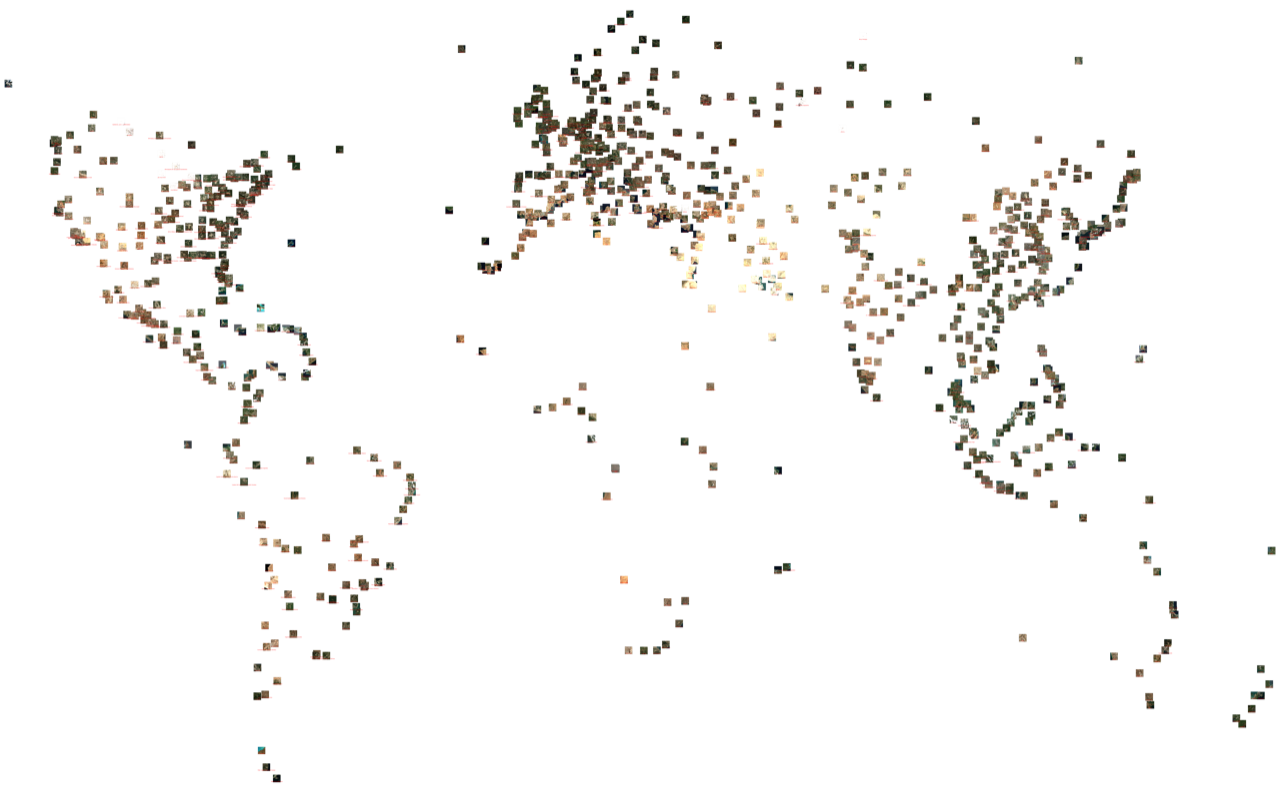
It is to be noted that the diversity of our dataset is extremely broad, since it is based-on airports across the world, in most countries. This includes an array of parameters, a few of them listed below:
- Altitude
- Level of urbanisation around the airport
- Size of the airport
- Orientation of the runway
- Presence of Water
- Presence of clouds
- Density of urbanisation
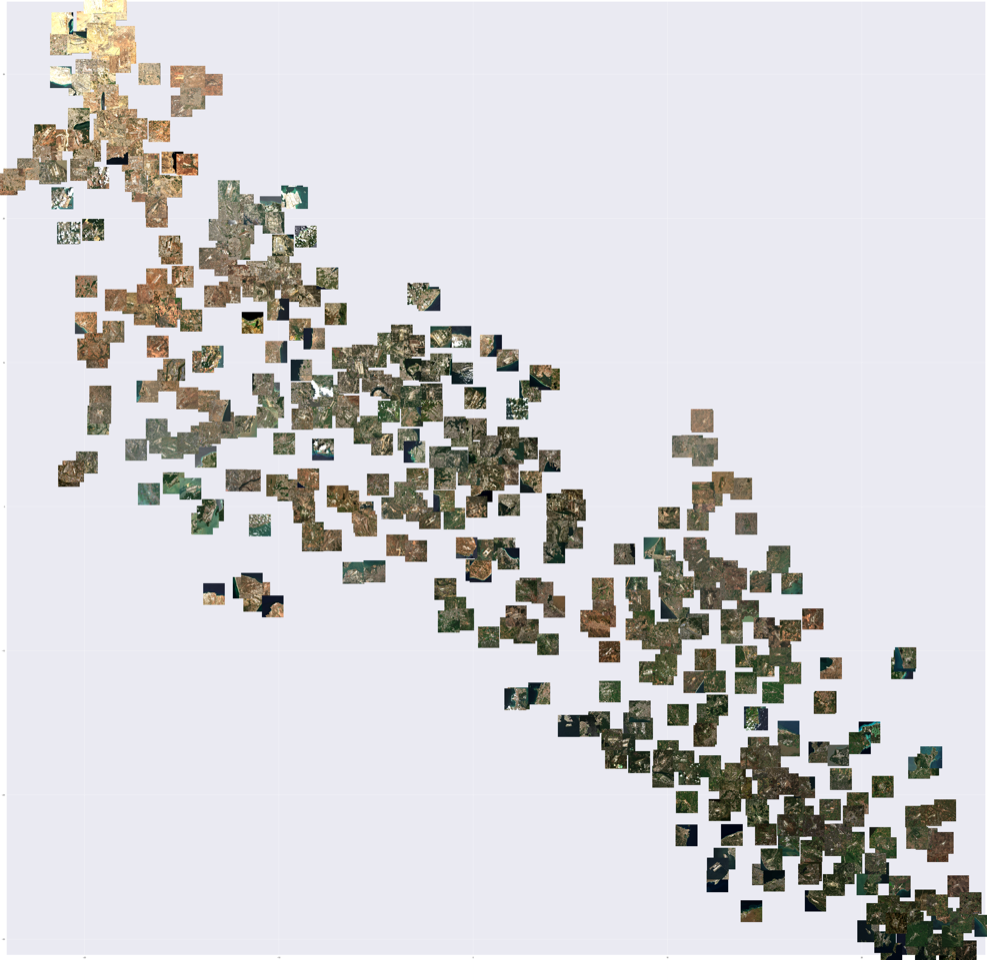
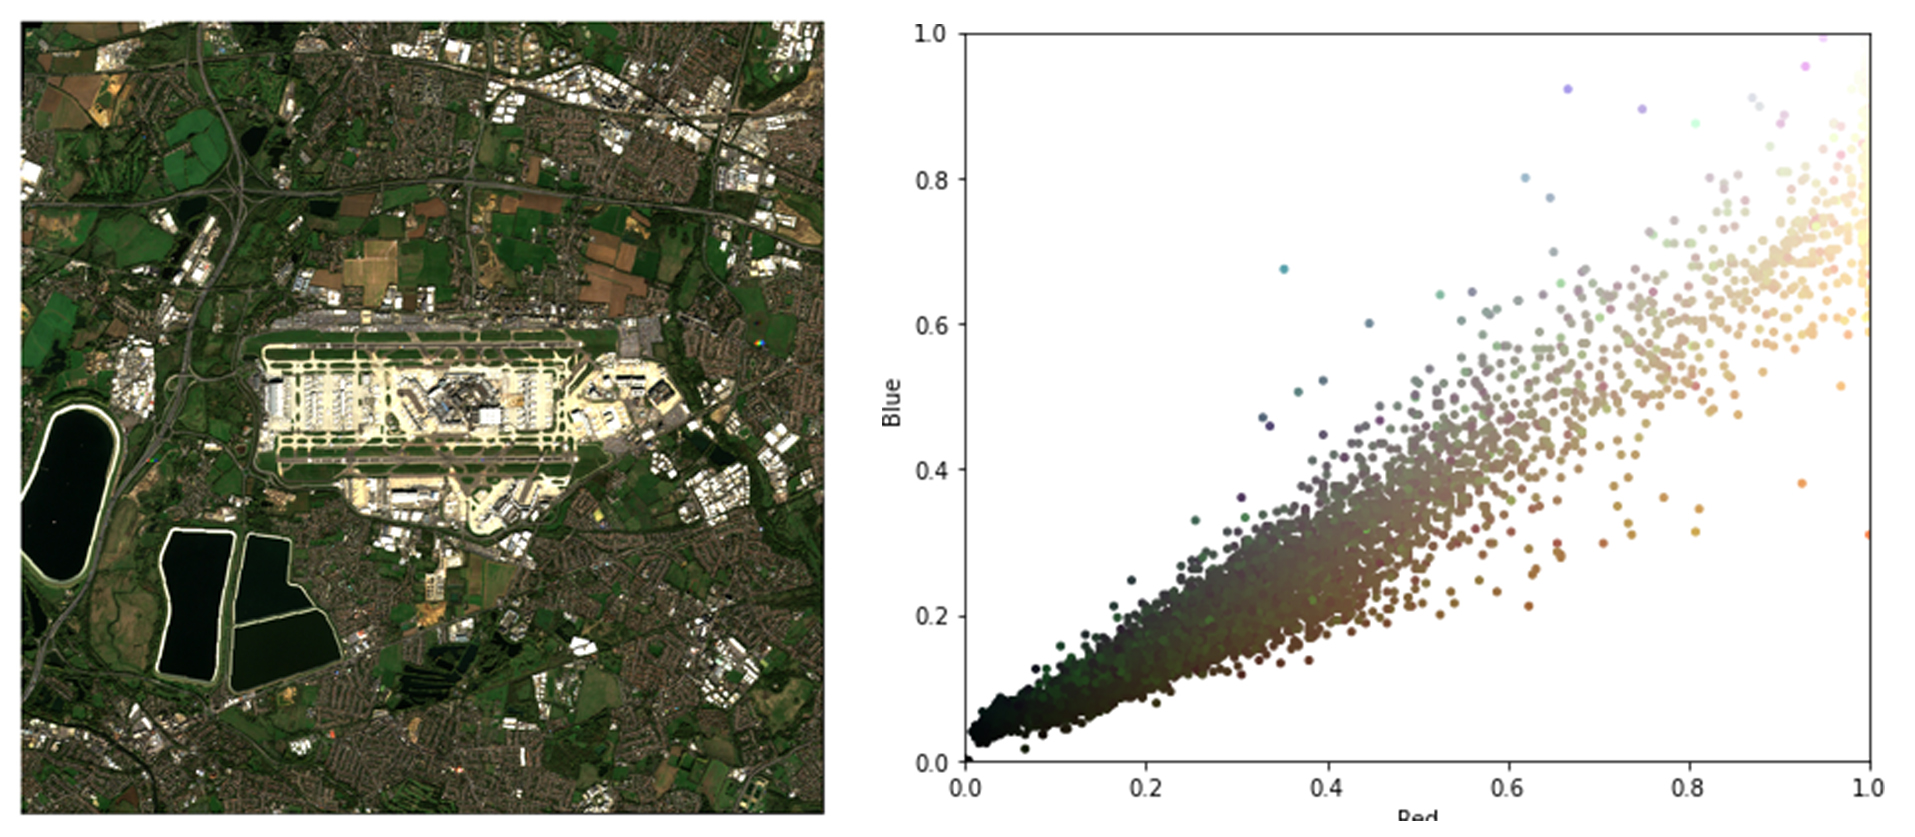
The colour parameters (HSV) when plotted shows interesting results at the same time raising many questions about land use, geography, and physical diversity in these images. Some of the more obvious observations were the different types of terrain like arid, urbanised, agricultural, and snow. It is intriguing to perform a study on these images to find out if their physical location influences their functional value like the ability to handle more flights, cargo and also in terms of pollution impact on the surrounding urban fabric.
Even simple operations such as sorting the images based on their dominant colour produce interesting results and often raises more questions than it answers. One such hypothesis is what kind of airports can easily support expansion/extensions to the terminal and/or runway, and how does the surrounding landscape support/discourage it. To answer this question, it is crucial to find out what constitutes the land that is around the airport. This could be achieved in multiple ways. Land use surveys are ubiquitous, common, and carried out by regional and local governments to classify the different land uses in their respective area of control, which is used for their periodic zoning plans. This is predominantly done in a manual fashion which involves volunteers carrying out physical surveys on-ground, which can be cumbersome and inefficient as a process and often could take a lot of time, with most of it wasted in getting the logistics right. But here, in this case, we would like to leverage the power of computation to explore a method of classification that is highly scalable and customizable. Since the size of our dataset is quite large (~1000+) and can potentially expand in the future, we need a self-learning system that can automatically make predictions on the target image to identify the different land-use cases. This can be achieved quite easily by using a K-Means clustering method, which looks for the different properties of each pixel and assigns a value for the class. Although this is straightforward and simple, as a process K-Means can sometimes be inefficient for classification due to the high K-count corresponding to the diversity of the dataset and more generally lies in the architecture of K-Means itself.
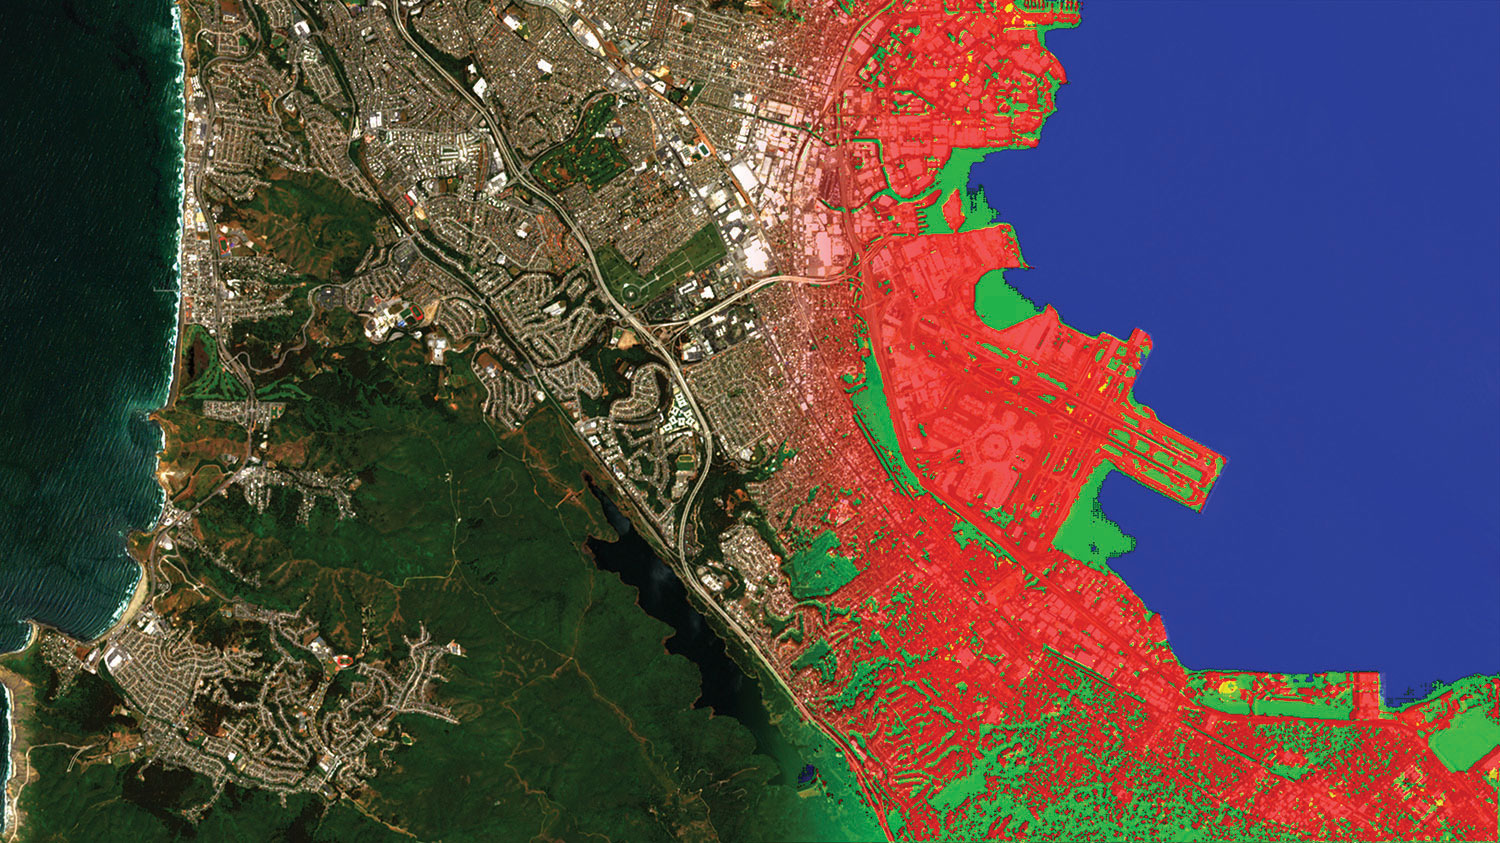
This is where we can leverage the potential of Machine Learning. ML though it is taking over many industries as it gets smarter each day, its prowess in the field of design especially early stages of design is highly unexplored. In our case, we would like to develop a model that can help us predict the different land use cases around the airport by learning metrics such as the pixel colour, position and adjacency relationships to accurately assign categories to each pixel based on the level of confidence. To do this, we decided to predict 4 major land use cases which are mostly found across our dataset though this could be extended further to be as diverse as possible even covering the rarer land uses. For simplicity, we devised vegetable land (green), arid land (yellow), water (blue) and built-up environment (red) and assigned colour codes so that these sets are disjoint. Another rule which we devised was each pixel can only represent one of the 4 classes, which means the class that scores the highest probability will be selected automatically to represent that pixel.
We explored multiple different ML model architectures including models that are pre-trained on millions of data points by Microsoft (ResNet), Google (InceptionV3) and from other third-party open-source repositories. Although these pre-trained Convolutional Networks had an extremely high level of prediction accuracies, they were trained on datasets and had classes which did not match our requirements. Secondly, the satellite images which were used to train these models had a comparatively high resolution (< 5m) which could create some inaccuracies since the image dataset we collated was of a different resolution.
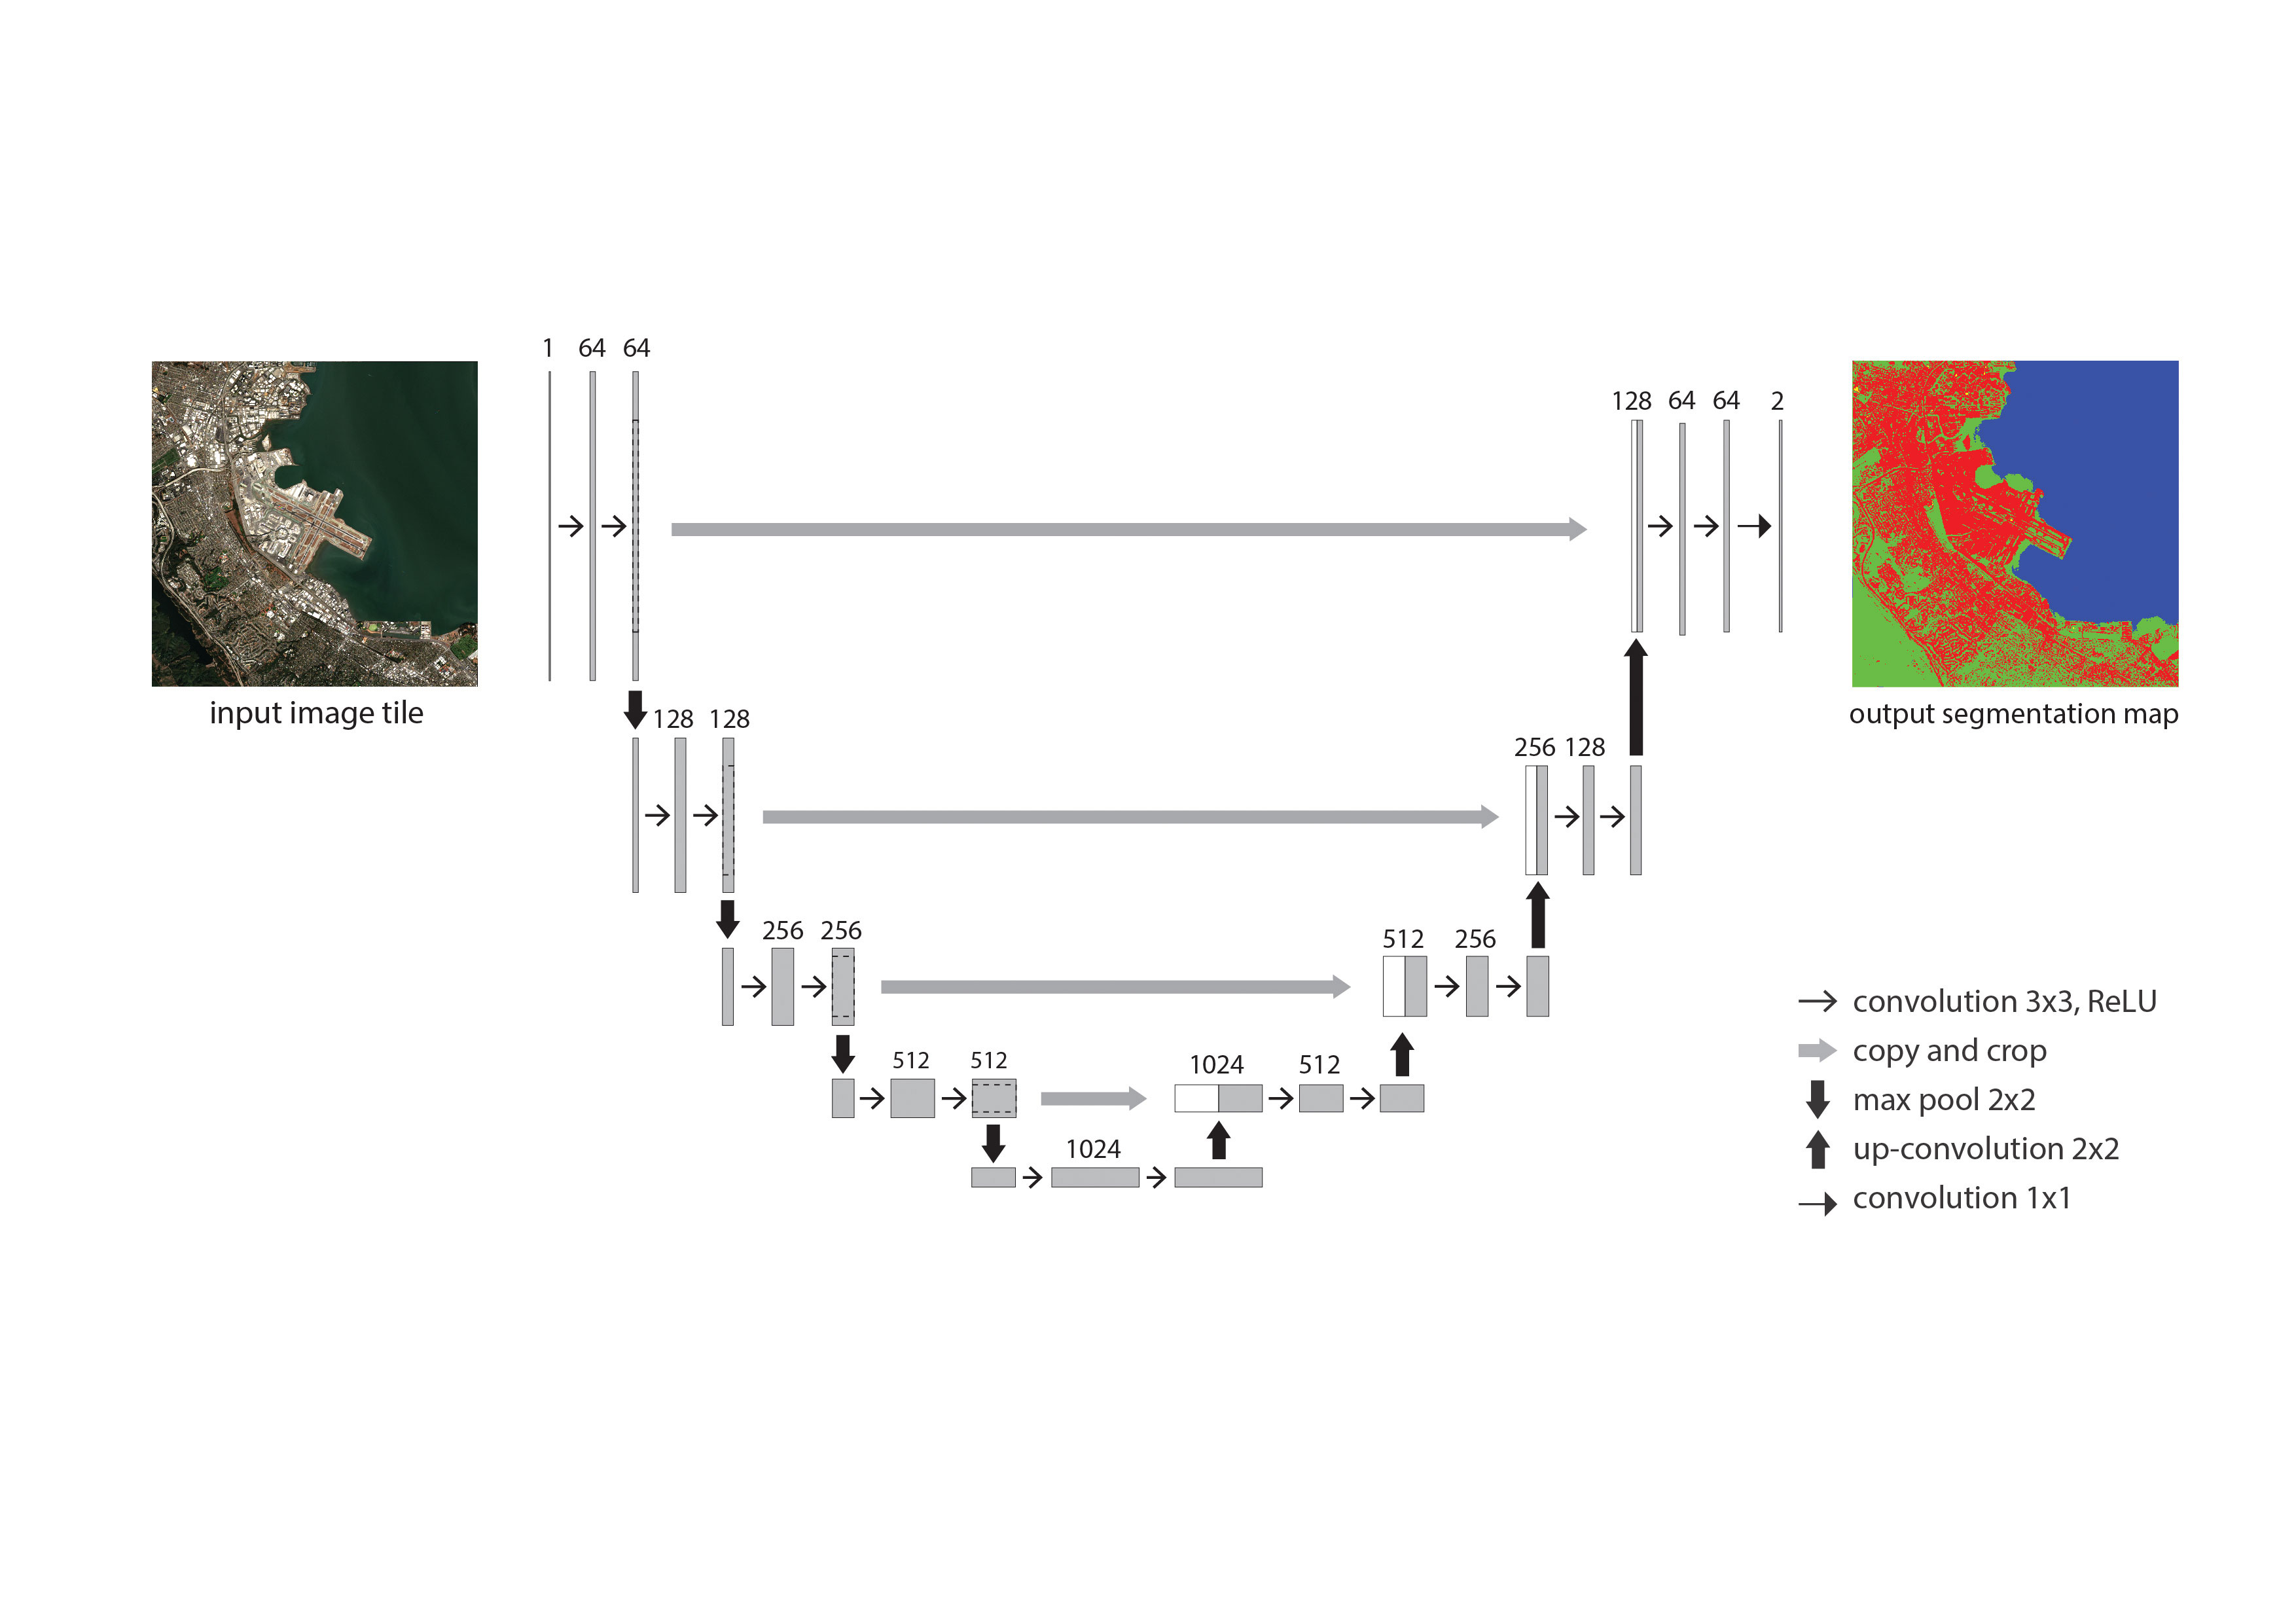
We chose to train our dataset in the U-Net architecture. Firstly, its fully convolutional and symmetric which will ensure the resolution of both the images and the features are preserved. Secondly, U-Net is known for its high convergence rate even with low sizes of the dataset. Traditionally, in Machine Learning practices dataset sizes are in the order of 104 but in our case, it is much lower and U-Net will efficiently be able to account for it. Thirdly, its supervised nature of learning enables to manually embed labels in the training dataset to the level which we desire the model to predict. U-Net has already been in use widely in geology as well as in medicine for its ability to predict salt within rocks as well as to detect brain tumour patterns.
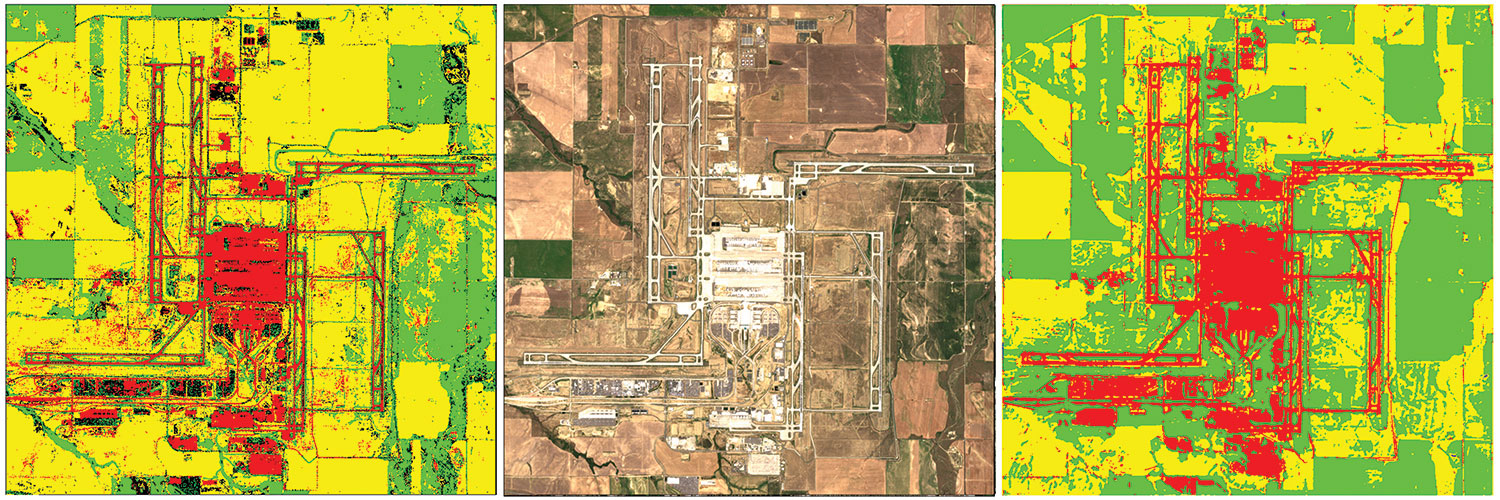
Fifty airport images were selected to loosely represent the entire dataset in terms of diversity in the level of urbanisation, cloudiness, proximity to the sea and other natural features. This process was done manually by inspection across the dataset. These images would serve as sample data points for the U-Net model to learn the different land-use features. These images were then manually segmented using the 4 classes as a key, as the ground truth labels using Photoshop. The coloured image maps were then transformed into a one-hot encoding, which will help preserve the classes as well as ensure that they remain disjoint to ensure a more accurate prediction. The images were stored along with its original RGB variants, which was together fed into the U-Net. The RGB image and the prediction masks were then fed into the network, which trained for about 300 epochs at an accuracy level of around 70% in about 5 hours. The training was carried out on an Nvidia GTX 1060Ti GPU.

These prediction masks were then decoded from the one-hot encoding and stored to file, along with its metadata. The masks are now ready to be processed further, to derive meaningful insights from the coloured pixels which can help us better understand these airports as well as provide valuable ground truth information around them.
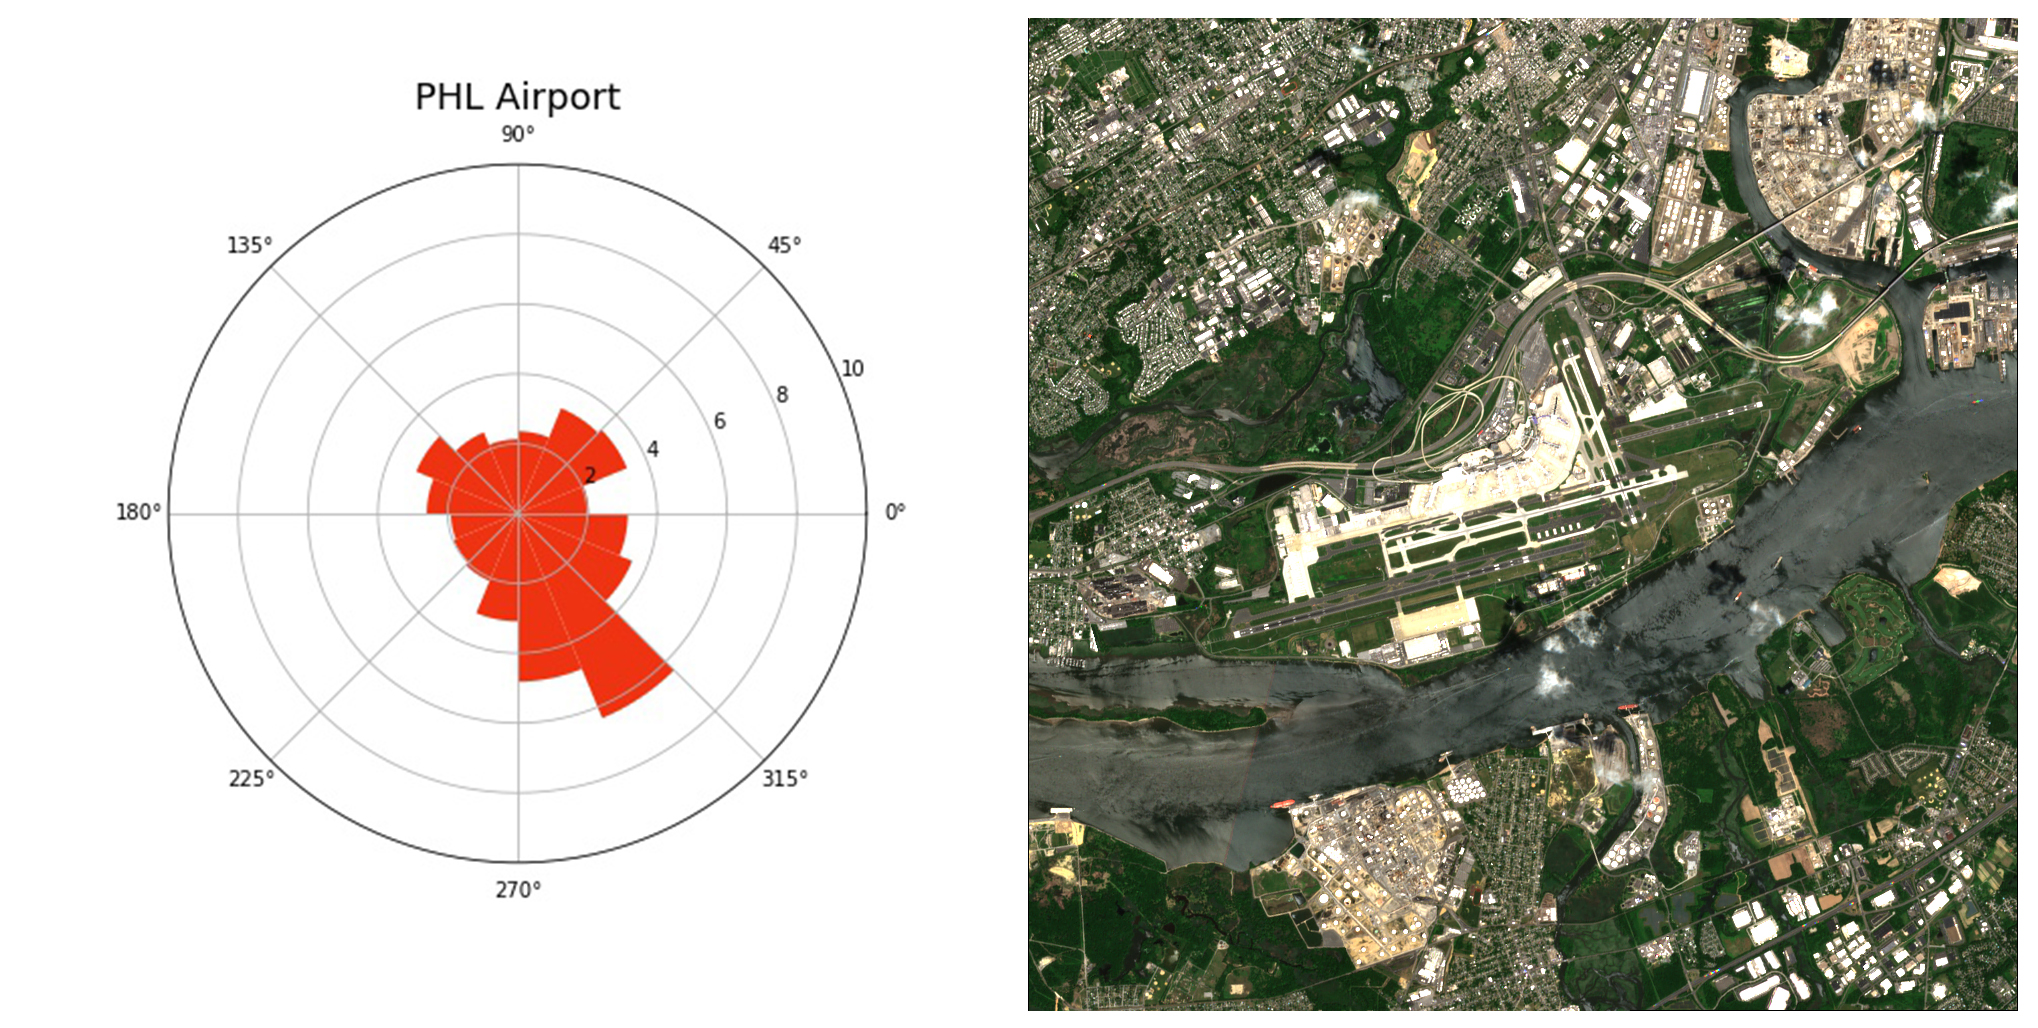
Having access to data that is accurate and near real-time, the possibilities of this system are endless. For instance, the ‘blue’ pixels can simply be filtered out across the whole dataset to understand which airports are in proximity to water. Even information specific to a particular airport can be obtained, like the ease of expansion by direction, which is extremely valuable to architects, designers and policymakers who can leverage on this piece of data to make planning decisions. This workflow can enable design decisionmakers to quickly prototype and visualise options at the early-stage design process in a fast and an analytical way.
We feel this could be game-changing especially enabling us to collect, process as well as analyse RGB satellite image data to understand the ground truth in a purely computational method. However, we strongly feel that this method could be refined to achieve a better accuracy as well as potentially including functional variables such as passenger traffic numbers in our case for airports.
This will further be explored in the upcoming part 3 of this study series which will put more focus on leveraging the methods discussed in this section which to come up with a meaningful conclusion; more specifically on framing macro-level urban planning decisions for the US airports based on their environmental impact as well as urban noise and congestion levels.
If you are interested in this work please get in touch with us.