Social Space
Using Social Relationships to Determine Spatial Arrangements
An investigation into placing individuals in workplaces, combining social interaction data and office seating arrangement analysis.
Office design, particularly layout and seat arrangement, can fundamentally impact office culture, productivity and experience of its employees. Depending on how employees are grouped and distributed within the floor plan, it could promote or hinder communication and collaboration among them leading to emergent social clustering.
An organisation comprises of various roles which all require different interaction environments. Some employees might be better positioned when speaking within their team (intra-cluster) while others are most productive working between groups (inter-cluster).
For some their seats might be best placed when easily visible to others, or alternatively they could be most productive when in a position to better see others.
Depending on circulation of the floor plan, an employee could be in a very accessible position to others. This could lead to more beneficial exchanges or perhaps become distractions.
In this early stage work, we explore how existing social relationships within an organisation can be used for algorithmically suggesting or determining employee positions for office layouts in order to maintain or enhance these relationships.
The issue of productive offices is linked to how to match the complex social links between people to a good physical locations in the office space.
Social Relationships
In order to capture existing social relationships, an approach using email correspondences was developed. This approach could be used with any directed or undirected messages, however in this case the data represented the emails (what a from and to, thus 'directed') among a group of employees of an architecture firm within a period.
Each email comes with several useful elements of information; such as who sent it, to whom (which can be multiple recipients), when it was sent and what it was about (subject), along with the actual message.
This allows the examination of the general trends of communication within the employees represented in the emails. But more importantly it helps with establishing relationships among them and determining the strength of these relationships based on how much they had communicated.
There is prior evidence to imply that this represents a reasonable proxy for actual direct communication and interaction between individuals.
This approach also allows for wide scale organisation analysis with low invasiveness.
More in-depth information about this approach can be found here:
In-depth analysis of Social Data
Once the relationships are established, they can be represented as an interaction matrix.
This captures all messaging between people by having a row and a column relating to each person.
We can look at the row for all the messages sent by someone, and the row for all the messages received by each person.
Importantly this shows the asymmetry in most communication, where one person will message another more than that person messages them, for example managers are more likely to mass email large groups where a more junior people are likely to be more singular and directed in who they message but also message less.
Thus we are able to capture volume, spread and focus of both incoming and outgoing communication to each individual.
As these interaction matrices are not fundamentally different from other matrices widely used in engineering and statistical analysis, we can employ existing mathematical approaches to cluster them into socially active groups and visualise them as nodes and edges on a network graph as shown below.
However this clustering comes from the matrix representation which is shown below that.
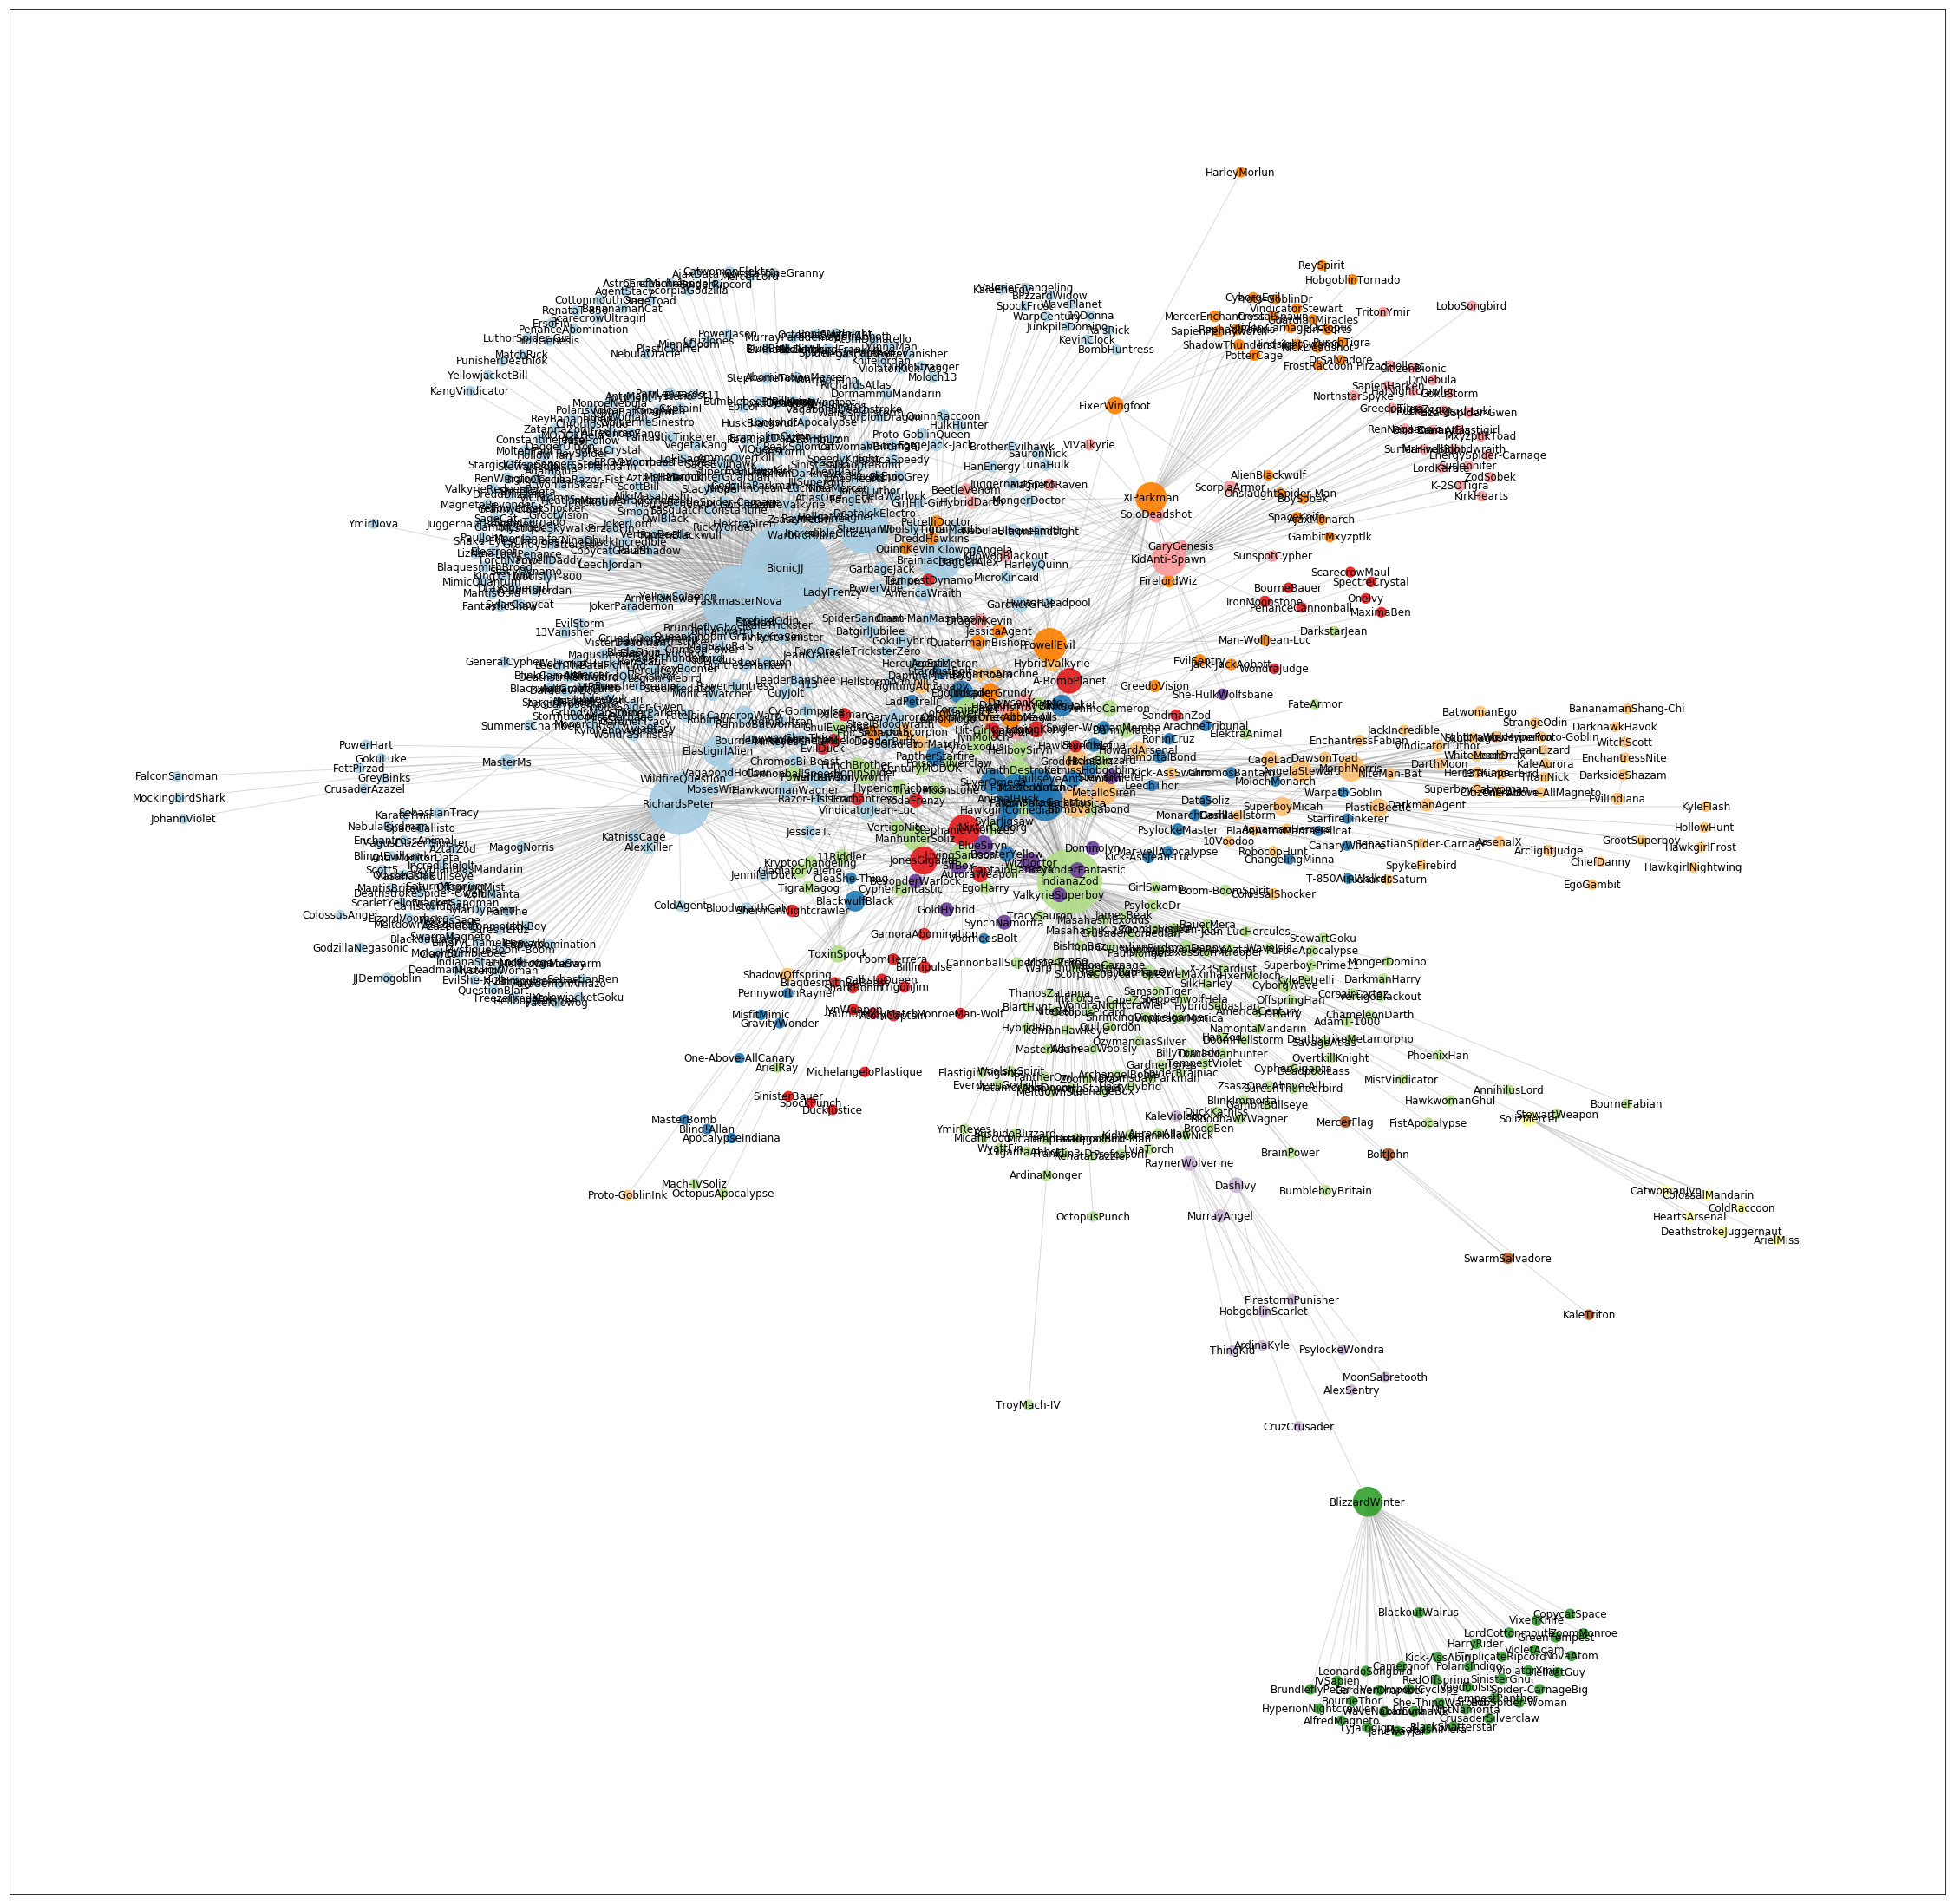
A network view of a social network, nodes are people sized by number of messages, edge lines between people shows emails between two people. Nodes are coloured by social group. The spatial arrangement is determined by 'Force Directed Method' this models nodes physically, where nodes are like particles and can move and have charge and repel each other, they are held together by springs placed between all people/nodes with messages between them with a strength equal to the number of messages.
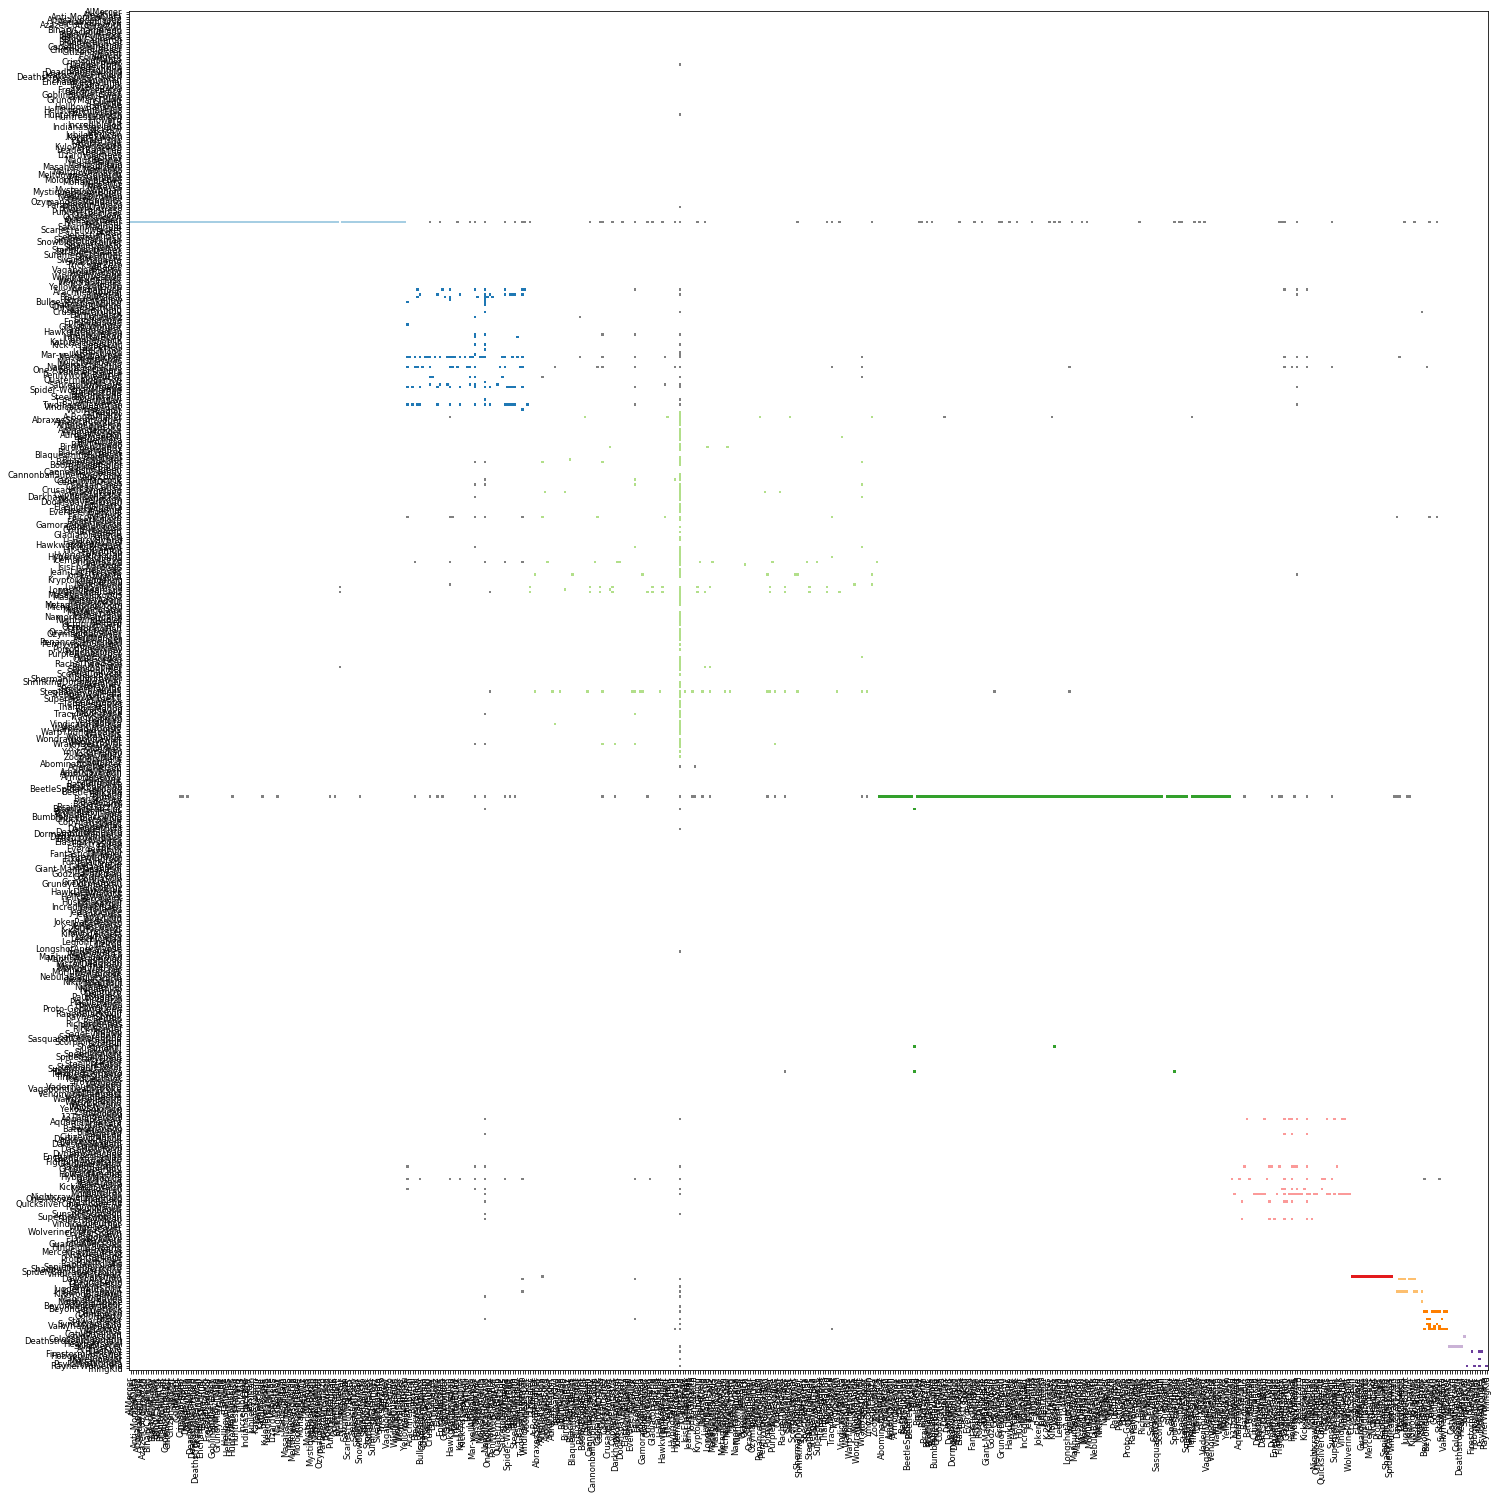
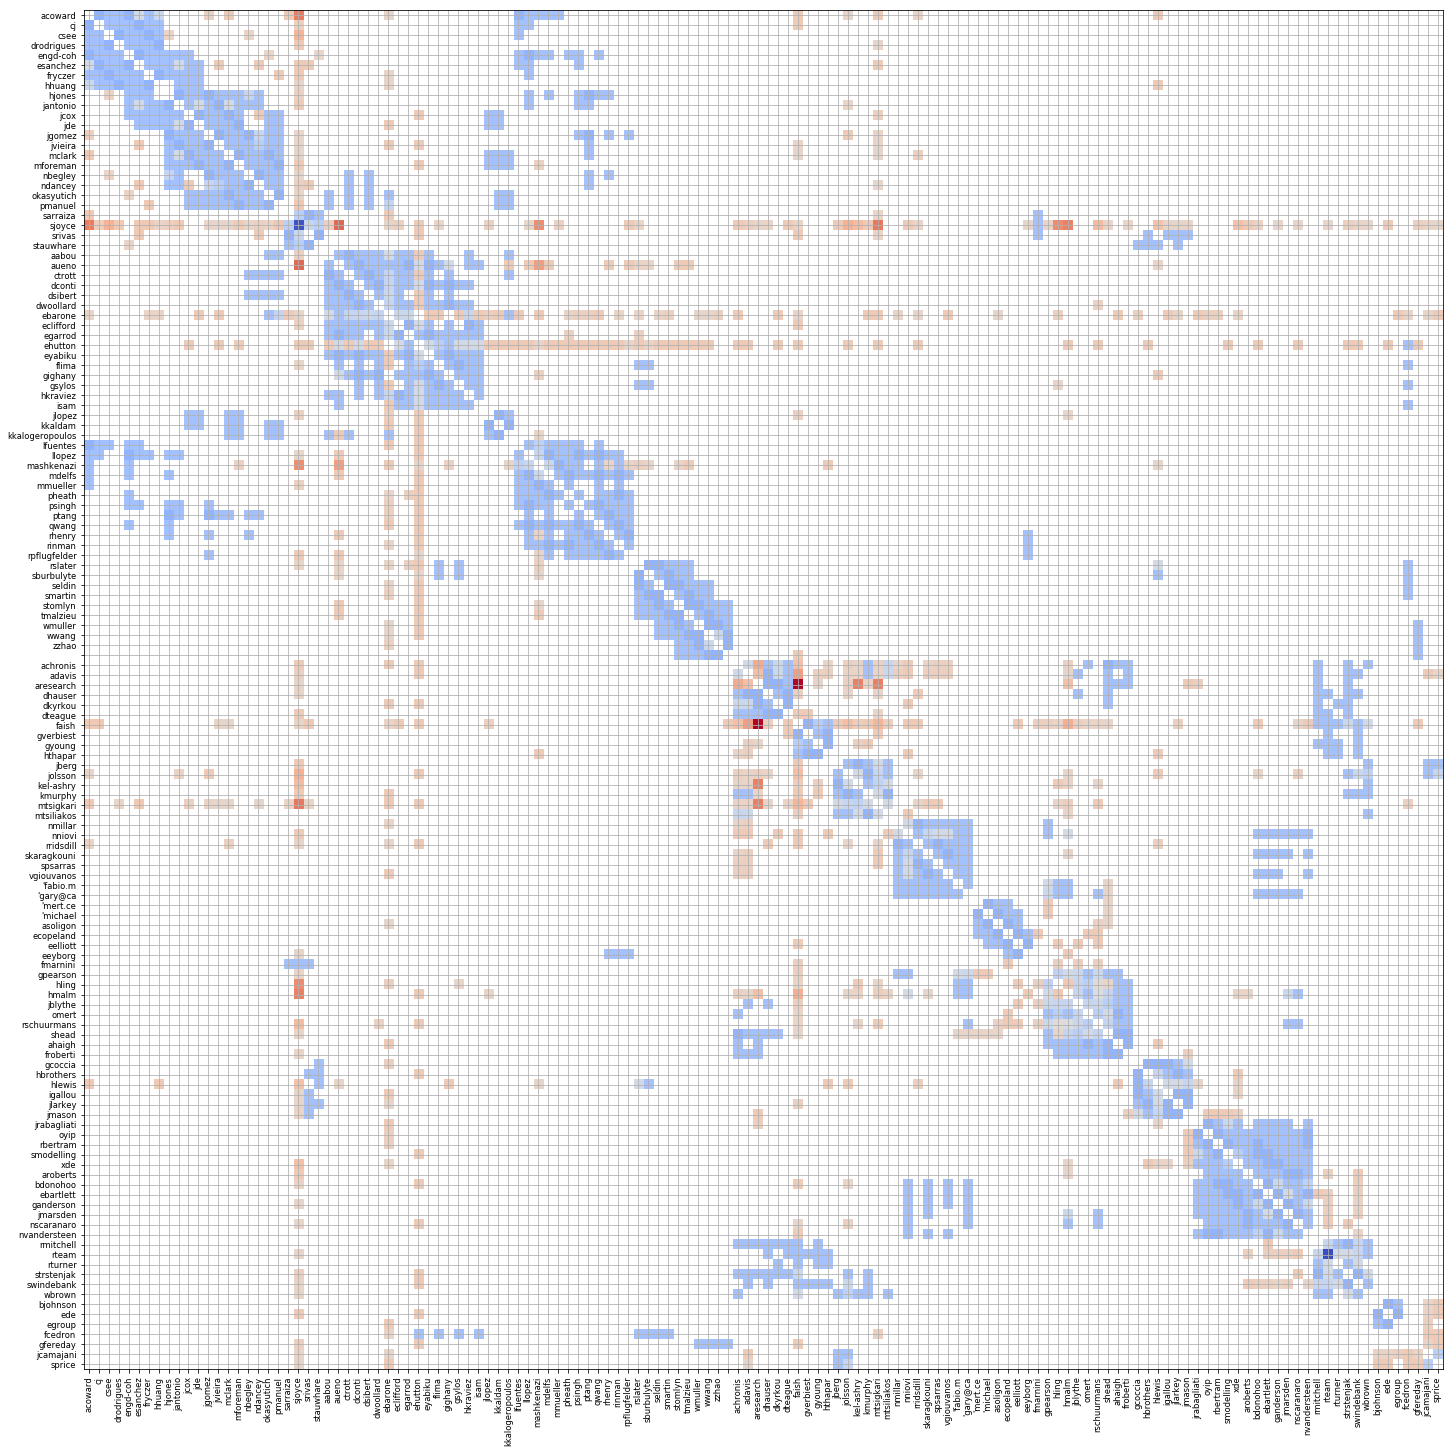
A view of the same social network above but as an interaction matrix. People are represented by row and column, a square in a cell represents one or more message between two people, sender is the row and receiver is the column. The darker the colour the more messages are sent. The colours are determined by social group, rows and columns are sorted by social group.
Spatial Arrangement
For analysis, we extract a simplified representation of the space.
In this case we capture a pre-existing open office plan, the boundaries of the floor-plate and the tables and seats.
Once the configuration is extracted from the plan, we can use the position and direction (orientation) of the seats to evaluate several spatial relationships between them.
These can be used to calculate relationships between seats; from simple attributes such as euclidean distance to more complex ones such as proxemics.
It is also possible to automatically determine reasonable walking paths in the space and calculate how much distance they have to travel to reach each other.
Further details of this can be found in the below link:
In-depth analysis of Spatial Data
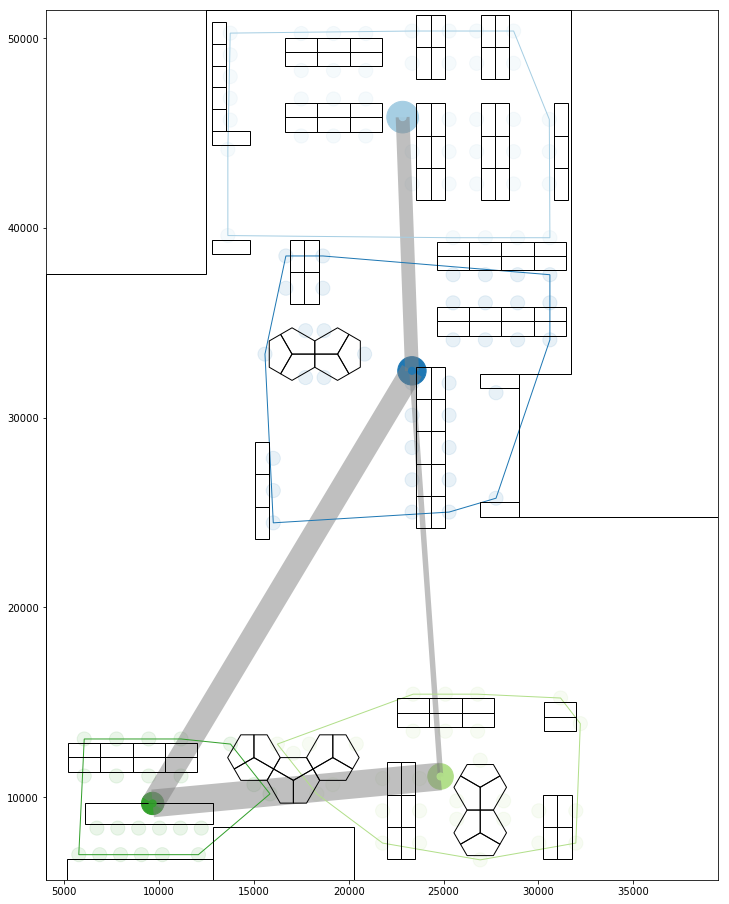
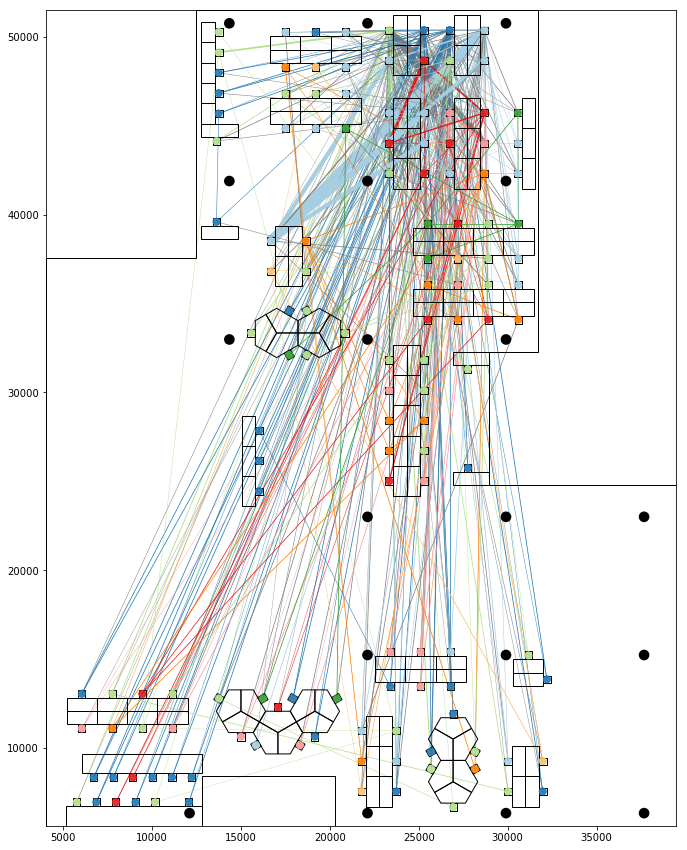
Image showing clustered seatings and inter group connections
These spatial relationships can be combined to develop metrics of visual and spatial cohesion between the seats. The combined metrics relate all seats to each other; similar to the social networks there is an asymmetry between the connections. Due to orientation a seat may overlook another but not vice versa, for example if it is facing away. These features can be represented in a spatial potential interaction-matrix, which can then be used in creating groups of seats that have strong spatial connections as visualised on the floor plan below.
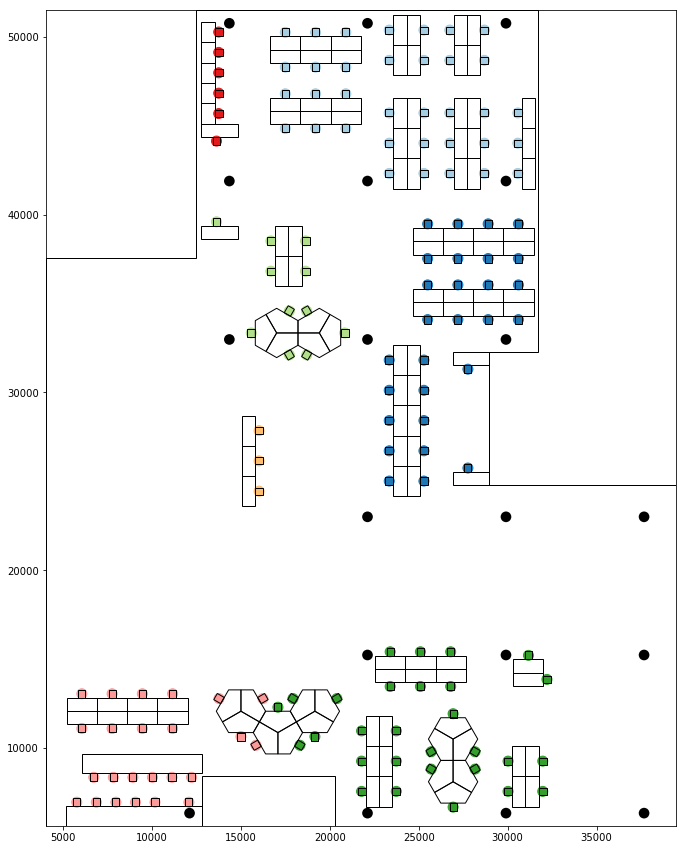
A plan view representing the spatial groups of the seats. The groupings are determined by their spatial connections based on visual and distance metrics. The non-orthogonal seating arrangements around the pentagon tables create more complex orientations which affect their visual relationships and spatial groups.
Data Preparation and Seat Assigning
Both social and spatial clustering data can be encoded as simple lists of names and seat positions along with their assigned group number.
This allows us the flexibility of indexing and sorting the lists individually according to their different attributes.
Seats assigned are represented as a third list made of merged data of the seat and the person assigned to it.
So each row in the list carries the name and social group of the person along with the position and spatial group of the seat assigned.
Matching itself is non-trivial and highly dependent on how one intends to utilize the space, specifically its desired influence on the users.
The approach here is to correlate social interactions with similar spatial configurations.
This is essentially the same as knowing what team you have and then fitting them into the space.
However it could also be possible to use the space to impose different conditions onto users in order to positively effect their interactions to increase interaction or focus etc.
Fitness and Evaluation
In order to evaluate how much the social relationships are suported by a given spatial arrangement, the edges in the two networks are compared to identify the difference.
For each pair of social connections a score (k) is calculated as the difference between their normalised social (s) and new spatial (m) strength:
k=m-s
This creates a uniform scale between -1.0 and 1.0 where the goal is to obtain a k value of 0.0 and above.
Zero represents those pairs which maintained their social strength in the seating arrangement, while any value below represents those that did not.
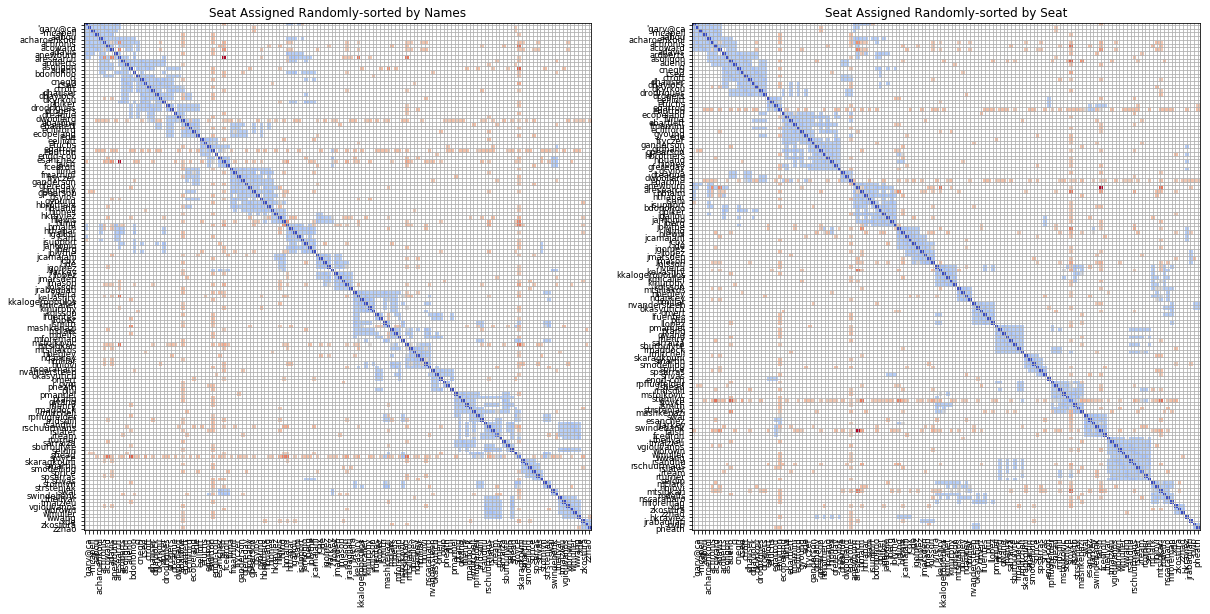
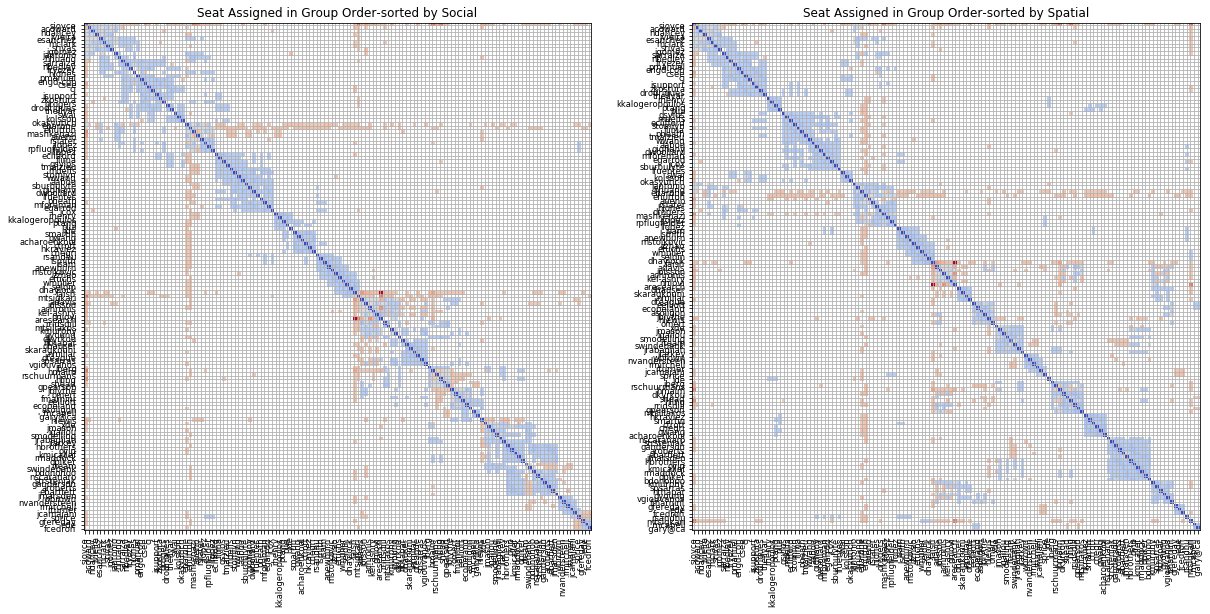
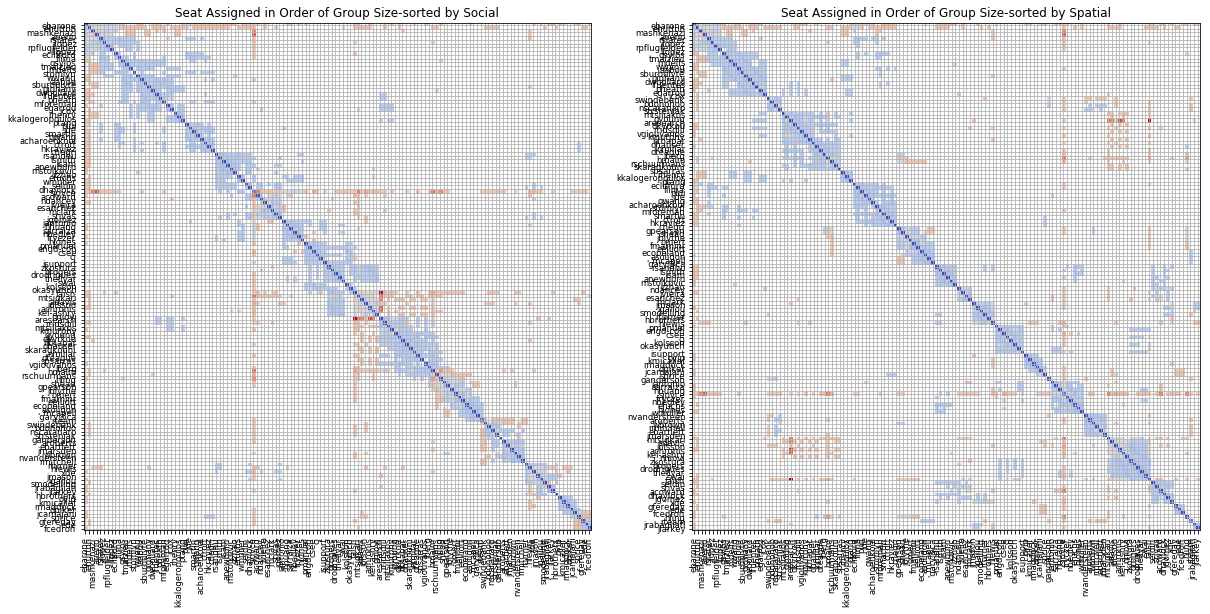
This could be visualised using a matrix as shown below.
A matrix showing the comparison between the social and spatial interactions of each pair. The colors and intensity represent the difference in interaction strength on a scale from -1 to 1 with red being positive. The goal is to atleast match the social strength with spatial so the more 'red' the matrix becomes, the better.
From this we can evaluate an overall fitness score for the seating arrangement based on the sum of the overlapping connections between the social and the spatial network.
One direct formulation for this, applied in this case is below:
fitness score (k)=100*(total social connections - number of social connections missing in new spatial arrangement)/total social connections
This allows us to compare using a singular heuristic metric the success of different seating arrangements.
Reseating and Analysis
Random Seating
For a base line comparison, we started with a random seat assignment and evaluated the impact on social vs spatial connections.
In this example the fitness score based on the above formulation comes to k=2.32.
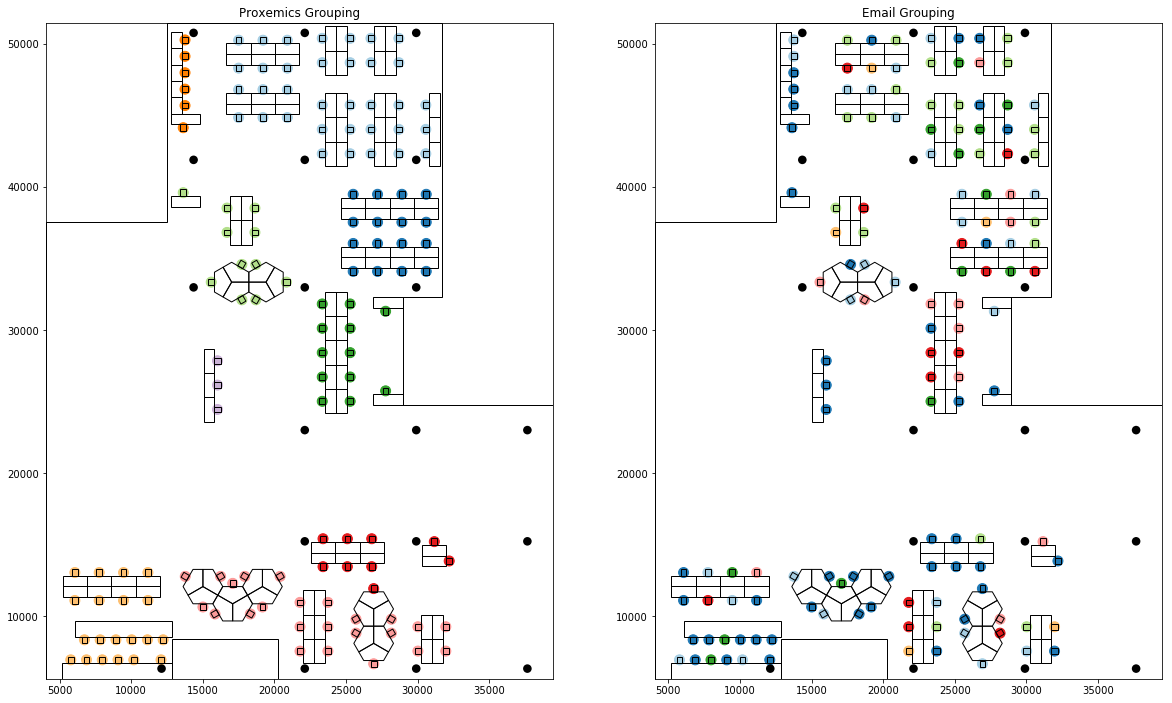
The layouts below represent the spatial and social groups and the matrix graph highlights the difference in social and spatial relationship for individual pairs.
As evident from the social layout, all of the social groups have been broken up and distributed around the floor plan, creating a weakly connected social space.
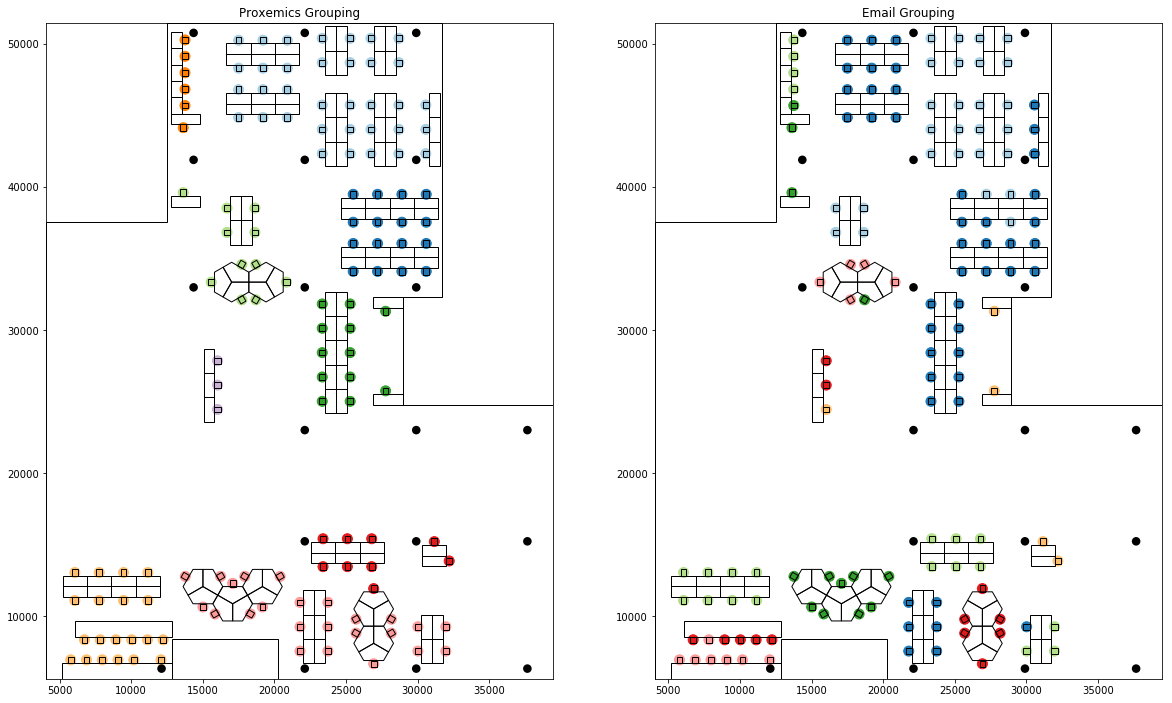
Seating based on lists sorted by group number
One instinctive way to create a more connected distribution is to sort the two lists according to their cluster numbers so that employees are seated in order of their social groups along seats belonging to same spatial groups.
This resulted in an improvement in fitness score to k=7.24 and created a much better distributed layout as seen below.
However, since the numbers assigned to each cluster are not in any specific order, sorted groups might not be spatially close together. And any 'spillover' as a result of different social to spatial group sizes could end up separating employees in same social group into spatially far groups.
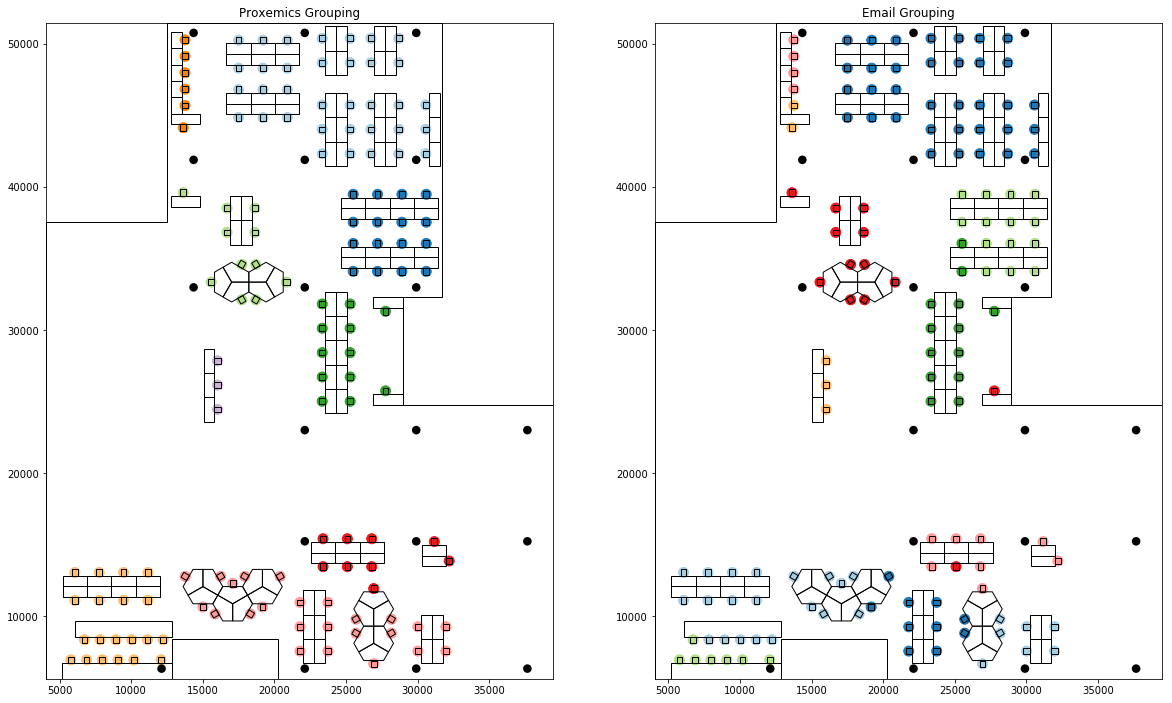
Seating based on lists sorted by group sizes
Potentially, the spillover effect can be avoided by matching the groups based on their sizes. In order to do that, both lists were ordered based on their cluster sizes so that the larger social groups would be seated in the larger spatial groups first.
This resulted in further increase in fitness score to k=7.87 and the result was much more apparent in the layout as shown below.
While the spillover effect is not as apparent as before, its impact is still visible in parts of the layout.
Although the approaches presented here for matching the lists are simple and straightforward, they demonstrate how the two sets of data could be used to influence and improve the social interactions within a layout. The current approaches could be vastly developed and improved by adding further metrics at a cluster level (beyond size) and using them to find the best match.
Further work
Outlined above, are the approaches and findings from an initial study into the matter and as such lack certain considerations which would be addressed going forward.
One such consideration is in the level of detail used in spatial analysis. In the current study, only the locations and orientations of seats are used. While this might be enough as an abstracted layout, other spatial elements such as partitions and furniture along with circulation effecting parts of the building such as stairs, doors etc. could have a significant impact on visual connections and accessibility. Introducing them in analysis would provide a richer understanding of spatial relationships and the resulting groups
However, incorporating these into current method is non-trivial and requires more sophisticated geometric operations and calculations.
Another area where the current study lacks is in matching groups based on multiple criteria.This could be achieved by introducing additional metrics to current clusters as highlighted above.
The best match would ofcourse depend on the specific goals required. Eg: We could introduce the distance between spatial clusters and use it to match with the social strength between two clusters. In such a case we could match higher social strength with shorter distance so that two groups with social ties are closely seated.
Implementing this should be straightforward once meaningful metrices have been identified.
One aspect which could be introduced to further enhance the study is the comparison of different layouts and identifying which layout is best 'suited' for the given social network. This would require a network level analysis on both the social and spatial network and a similar matching approach to match them.
A collection of archetypical layouts could be identified and modeled in order to use in the comparison of different social networks.
Reflection
The ideas outlined here, along with the highlighted future work, could allow a designer to design a more custom layout tailored for the specific needs of the organisation that would occupy the space.
Given the implications of the layout on productivity and communication, such a design approach could potentially enhance the work environment beyond the physical space and improve the overall organisational health.
Moving forward we are keen on collaborating and working with others researchers and designers. So if you are interested in this work or have feedback on the study, please get in touch with us.